Understanding Diagnostic Uncertainty

A frequently neglected component of shared decision making

At its core, shared decision making is a process in which decisions are made in a collaborative way, where trustworthy information is provided in accessible formats about a set of options, typically in situations where the concerns, personal circumstances, and contexts of patients and their families play a major role in decisions. [1]

Recently I was asked to help a friend understand the results of a new biomarker test. He had been told his result was abnormal but, beyond that, was not able to find any additional information that would help him understand how to use the test result to help decide if additional testing is warranted. 

The test manufacturer’s website states that, using the recommended cutoff value, the test has a 91% negative predictive value and a sensitivity of 92%, but has no information about the test specificity used to derive the negative predictive value. Fortunately there was a link on the website to the paper used to derive both the reported 92% test sensitivity and the test specificity used to calculate the negative predictive value, which is 30.1%. With this information I was able to quickly determine that his chance of having a significant problem warranting additional workup is somewhere between 10% and 25% based on what I thought his pre-test probability might be.  

For patients to adequately participate in managing a problem, they need to know what the possible diagnoses are and how certain, or uncertain, they are. The role of diagnostic tests is to provide information about disease likelihoods in an understandable manner that can directly help people make good management decisions.

 Currently, the best way to characterize decision related uncertainties is through the use of probabilities. Calculating or estimating diagnostic probabilities that result from a diagnostic test requires a basic understanding of Bayes Theorem and its proper application. Bayes theorem was derived in 1763 by Reverend Thomas Bayes. [2] It was introduced into Medicine in a 1959 paper by Ledley and Lusted [3] and popularized in a series published in the Annals of Internal Medicine in the early 1980’s. [4] Although frequently taught to medical students, my impression is that it is just as frequently forgotten and rarely used in clinical practice. From what I have seen, it is also not applied in diagnostic test research studies in a way that will inform clinical decisions. Most publications seem to focus on the test and fail to provide information useful for clinicians and patients wishing to understand how to use test results to make manage clinical problems.

Using Bayes Theorem to determine the likelihood of disease following a test result requires three pieces of information: test sensitivity (the proportion of people known to have disease who have a positive test), test specificity (the proportion of people without disease who have a negative test), and the probability of disease before the test results are known – the pre-test probability. Test sensitivities and specificities are determined by comparing test results with an unrelated test or other way of establishing the presence or absence of disease. The pre-test probability is usually considered a subjective probability that measures the strength of belief that the disease is present. For some conditions diagnostic calculators are available that estimate disease probability based on collections of clinical variables. If available, they are excellent ways to estimate pretest probabilities. Once the three key quantities are known, the probability of disease following a positive or negative test result can be easily computed. There are a host of Bayesian calculators freely available online. I particularly liked the one at Betterexplained.com

Musings

Failure to use Bayes theorem to provide clinicians and patients with probabilistic information about diagnostic test results is both a shame and completely unnecessary.  

References

1. Elwyn G, Durand MA, Song J, Aarts J, Barr PJ, Berger Z, et al. A three-talk model for shared decision making: multistage consultation process. BMJ. 2017;359:j4891

2. Bayes’ theorem. https://en.wikipedia.org/wiki/Bayes%27_theorem

3. Ledley RS, Lusted LB. Reasoning Foundations of Medical Diagnosis. Science 1959;130.

4. Griner, P. F., Mayewski, R. J., Mushlin, A. I., & Greenland, P. (1981). Selection and interpretation of diagnostic tests and procedures. Annals of Internal Medicine, 94(4 II).

Forty years on a back burner

According to Makoul and Clayton [1], the concept of shared medical decision making originated over 40 years ago in a 1982 report published by the President’s Commission for the Study of Ethical Problems in Medicine And Biomedical And Behavioral Research titled Making Health Care Decisions. [2] Here are two pertinent quotations from the report:

It will usually consist of discussions between professional and patient that bring the knowledge, concerns, and perspective of each to the process of seeking agreement on a course of treatment. Simply put, this means that the physician or other health professional invites the patient to participate in a dialogue in which the professional seeks to help the patient understand the medical situation and available courses of action, and the patient conveys his or her concerns and wishes. This does not involve a mechanical recitation of abstruse medical information, but should include disclosures that give the patient an understanding of his or her condition and an appreciation of its consequences (p. 38). 
Shared decision making requires that a practitioner seek not only to understand each patient’s needs and develop reasonable alternatives to meet those needs, but also to present the alternatives in a way that enables patients to choose one they prefer. To participate in this process, patients must engage in a dialogue with the practitioner and make their views on well-being clear (p. 44).
Musings

Sadly, as far as I can tell, we haven’t yet learned how to incorporate these ethical imperatives into routine clinical practice. It’s time to return to the drawing board. I doubt much progress will be made until decision making becomes a core subject for clinicians.

References

1. Makoul G, Clayman ML. An integrative model of shared decision making in medical encounters. Patient education and counseling. 2006 Mar 1;60(3):301-12.

2. President’s Commission For The Study Of Ethical Problems In Medicine And Biomedical And Behavioral Research Making Health Care Decisions, October1982. Available at https://repository.library.georgetown.edu/bitstream/handle/10822/559354/making_health_care_decisions.pdf?sequence=1&isAllowed=y.

The Busara Clinical Decision Making Framework Deliberative phase – Part 3 – Pairwise Comparisons

Review

The Busara Clinical Decision Making Framework (BCDMF) deliberative phase is designed to be used when decision makers are not ready to make a decision after examining decision-related data and tradeoffs intuitively. Use of the deliberative phase should be considered anytime decisions present difficult tradeoffs and/or when making high stakes decisions, particularly those that cannot be reversed, such as having surgery. 

The BCDMF is based on multi-criteria decision analysis (MCDA). MCDA is designed to help people make better choices when decisions involve tradeoffs between competing decision objectives, a characteristic of many medical decisions. There are a number of well developed MCDA methods. They all use the same basic decision model but differ in the method used to identify preferred alternatives. A nice feature is that the methods can progressively build on each other, so it is possible to increase the complexity of an analysis without needing to start over. [1]

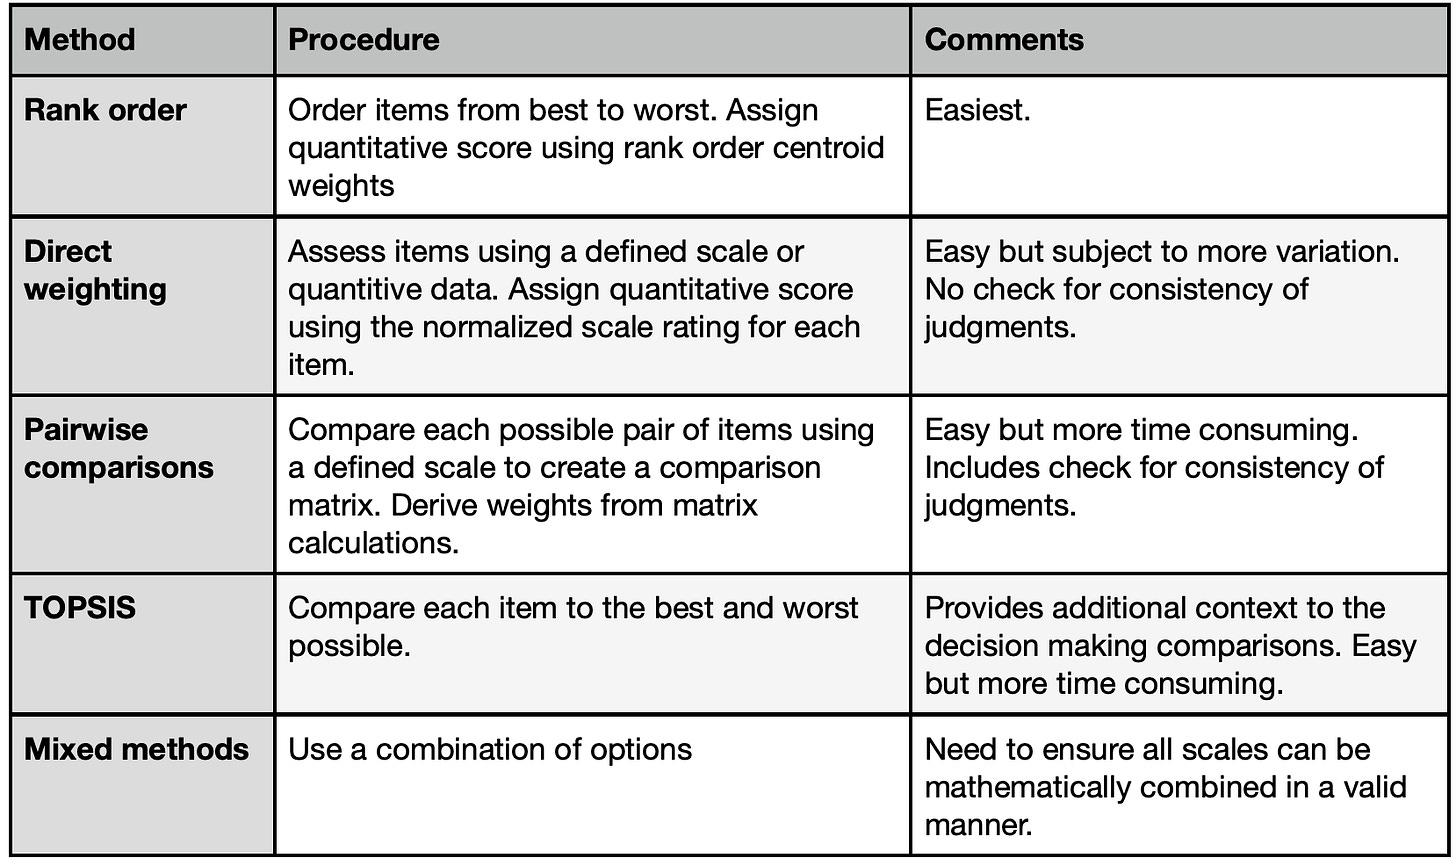
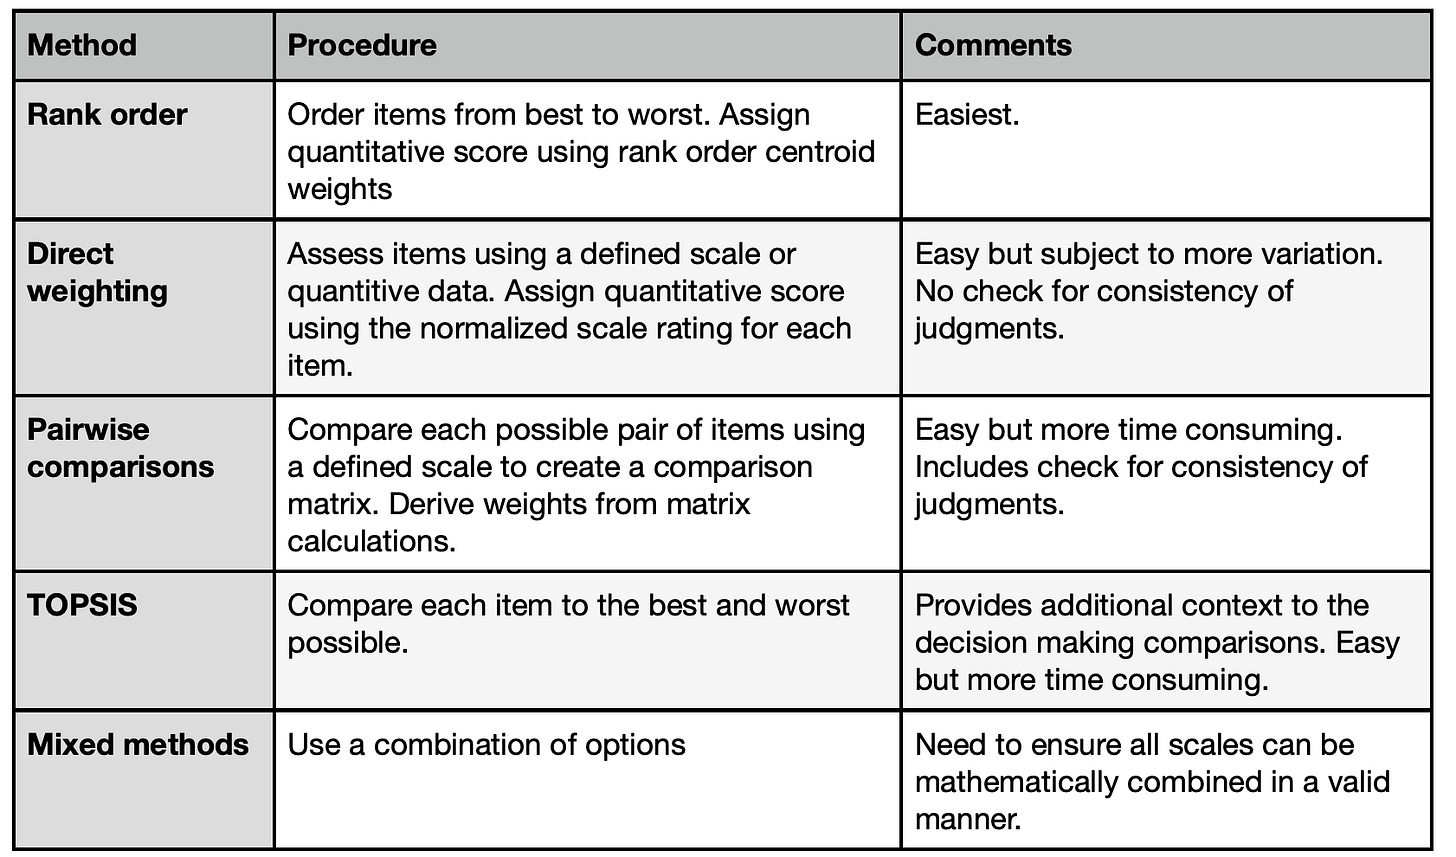
The methods included in the Busara Clinical Decision Making Framework are listed in the following table. They can be applied to both assessing the relative priorities of the decision criteria and how well the options meet the criteria. 

All of these methods work by creating quantitative scales that reflect decision makers judgments about how well the options meet the criteria and the priorities of the criteria relative to the goal. These scales help characterize the judgments being made in the decision making process more exactly than possible using qualitative terms or intuitive feelings. They therefore provide a new and enhanced way for decision makers to  communicate with each other about their preferences and priorities. They also enable decision makers to explore how changing their initial preference and priority judgments affects the overall assessments of the options under consideration. 

Pairwise Comparisons

The BCDMF pairwise option approach reduces the decision judgments to their simplest form: a single judgment between just two of the decision elements (options or criteria). This approach is used in the Analytic Hierarchy Process (AHP) a well-known decision making method. 

The advantage of the pairwise method is that it focuses attention on each individual component of the decision. In doing so, it provides a fundamentally different way of thinking about the tradeoffs and judgments involved in making a decision than the other methods included in the BCDMF (and many other formal decision making techniques). This difference can help decision makers gain additional insight into the decision at hand and help them refine their personal preferences and priorities. The disadvantage of the method is the inevitable increase in the number of discreet judgments that must be made if the decision is broken down so completely. 

The benefit of the approach depends on whether the additional insight is worth the additional work involved. Examples include situations where a clear best choice has not emerged after using the other methods provided in the framework and when making a particularly high stakes decision, where the role of a good decision making process is paramount. A good way to use the pairwise comparison format is to minimize the work involved by using the earlier steps in the process to highlight the key features of the decision and identify a short list of options that are worth further in-depth analysis.

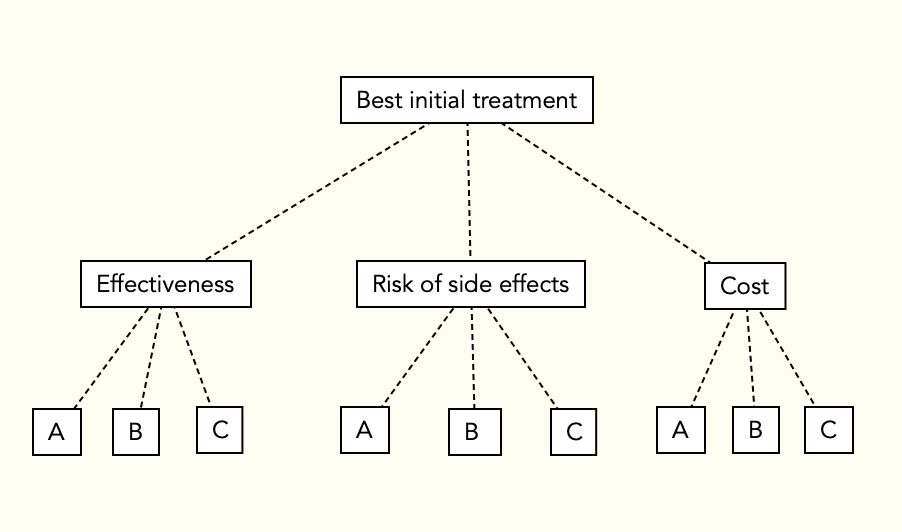
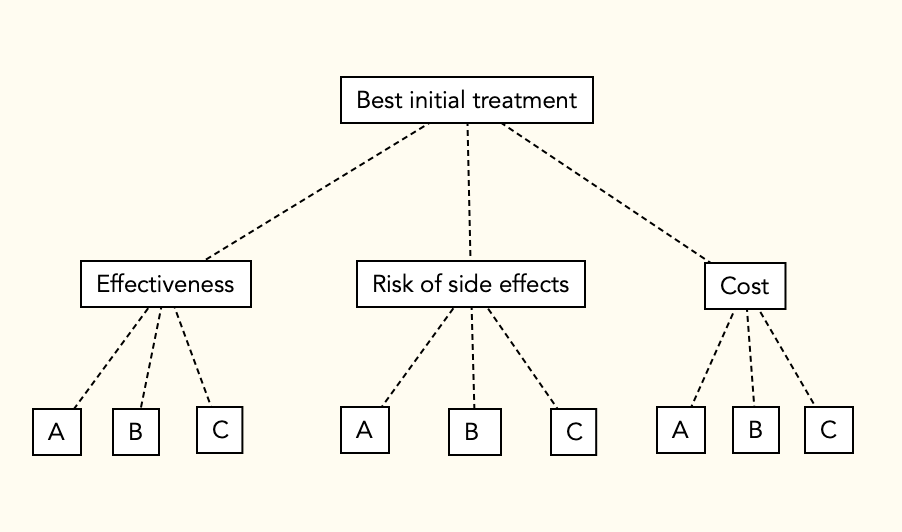
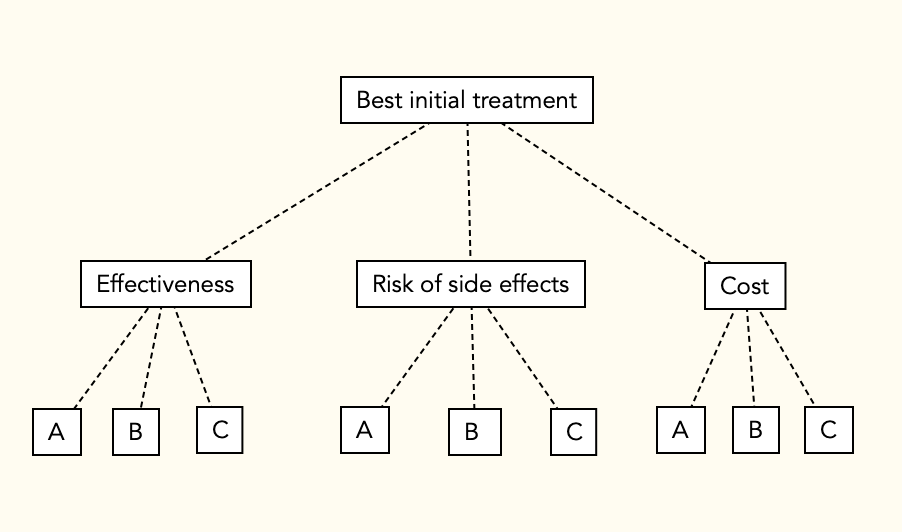
To illustrate, let’s continue to use the example scenario where a doctor and a patient named Anna are choosing among 3 possible treatment options using the following decision model. 

They collect data summarizing how well each option will fulfill each of the three decision criteria:

They then evaluate the options and prioritize the criteria using both ordinal rank weights and direct weights, as explained in the last two Musings. The results are summarized below:

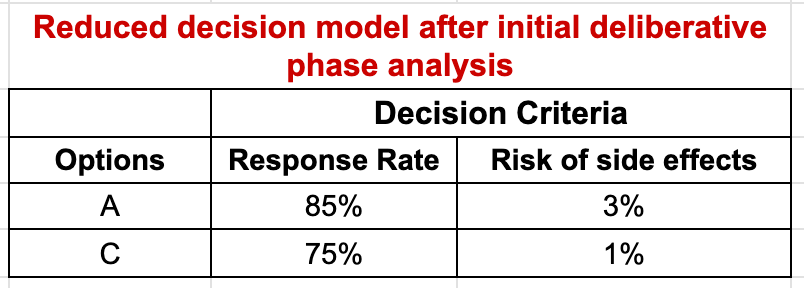
Now let’s assume that on the basis of the analysis so far, Anna eliminates Option B from consideration but is still unsure whether she prefers Option A, which is better in terms of effectiveness, or Option C, which is the safer option. She also decides to eliminate the cost criterion, since she can afford both of them equally well. The resulting decision matrix is shown below: 

Anna and her physician then decide to use the Pairwise Comparison technique to take a closer look at the differences between these two options. For the judgments regarding how well the options fulfill the criteria, the first step is to decide if the two options are equivalent. If not, the preferred option is identified and the strength of preference judged on a four-point scale: slight (2), moderate (3), strong (4), or very strong (5). These judgments are then entered into a judgment table or matrix. With only two comparisons, this is a 2×2 table. Each row show the relationship between the Row option and the Column option:

Option scores are calculated by normalizing the geometric means of the row totals. The comparisons between the criteria are made the same way with the judgments made in terms of how important each is relative to the goal of the decision.

The judgments required for Anna’s analysis are summarized below:

  • Response Rate: Option A (85%) vs Option C (75%)
  • Risk of Side Effects: Option A (3%) vs Option C (1%)
  • Response Rate vs Risk of Side Effects relative to the decision goal

Let’s assume that  Anna moderately prefers A to C relative to Response Rate, slightly prefers C to A relative to Side Effects, and judges Response Rate moderately more important than risk of Side Effects relative to the decision goal. The resulting comparison tables, geometric means, and scores are shown below:

The final results are calculated using the weighed average method, just like the ordinal rank weighting and direct weighting methods: overall scores are calculated for each option by multiplying the option criteria weights times the criteria priorities and summing the results. To make it easier to review and discuss the scores, they are multiplied by 100 to remove the decimal places.

Musings

Although this and the other deliberative methods I have described seem complicated, that is only because I have been explaining how things work “under the hood”. Once the calculations are programmed into a suitable app or spreadsheet, the process only requires attention to the judgments being made. 

As I mentioned previously, another advantage of the quantitative deliberative methods is the ability to determine how changes in judgments would affect the final results. The ability to ask “what if” can add a great deal of insight into the key aspects driving a decision. 

References

1. Dolan JG. Multi-Criteria Clinical Decision Support: A Primer on the Use of Multiple-Criteria Decision-Making Methods to Promote Evidence-Based, Patient-Centered Healthcare. The Patient: Patient-Centered Outcomes Research. 2010 Dec;3(4):229–48.

The Busara Clinical Decision Making Framework Deliberative phase – Part 2

Direct Weights

The Busara Clinical Decision Making Framework (BCDMF) deliberative phase is designed to be used when decision makers are not ready to make a decision after examining decision-related data and tradeoffs intuitively. Use of the deliberative phase should be considered anytime decisions present difficult tradeoffs and/or when making high stakes decisions, particularly those that cannot be reversed, such as having surgery. 

The BCDMF is based on multi-criteria decision analysis (MCDA). MCDA is designed to help people make better choices when decisions involve tradeoffs between competing decision objectives, a characteristic of many medical decisions. There are a number of well developed MCDA methods. They all use the same basic decision model but differ in the method used to identify preferred alternatives. A nice feature is that the methods can progressively build on each other, so it is possible to increase the complexity of an analysis without needing to start over. [1]

The methods included in the Busara Clinical Decision Making Framework are listed in the following table. They can be applied to both assessing the relative priorities of the decision criteria and how well the options meet the criteria. 

All of these methods work by creating quantitative scales that reflect decision makers judgments about how well the options meet the criteria and the priorities of the criteria relative to the goal. These scales help characterize the judgments being made in the decision making process more exactly than possible using qualitative terms or intuitive feelings. They therefore provide a new and enhanced way for decision makers to  communicate with each other about their preferences and priorities. They also enable decision makers to explore how changing their initial preference and priority judgments affects the overall assessments of the options under consideration. 

In last week’s Musing (April 28, 2023), I described the rank order weighting method. The beauty of the rank order weights is their simplicity. Once the rankings are established the work is done. However, how well they work depends on how accurately the rank order weights match the judgments of the decision maker(s). For this reason, the BCDMF tool contains a direct weighting module that allows decision makers to adjust the weights that have been automatically assigned by the ranking process. (This module can also be used directly – there is no need to do the ranking first.)

To review, suppose a doctor and a patient are choosing among 3 possible treatment options using the following decision model. 

They collect data on how well each option meets the three criteria and rank order them for best to worst in each category. The results of the example ranking and ordinal rank weights are shown below. 

They also rank order and weight the three decision criteria in terms of how important they are in meeting the goal of picking the best initial treatment option:

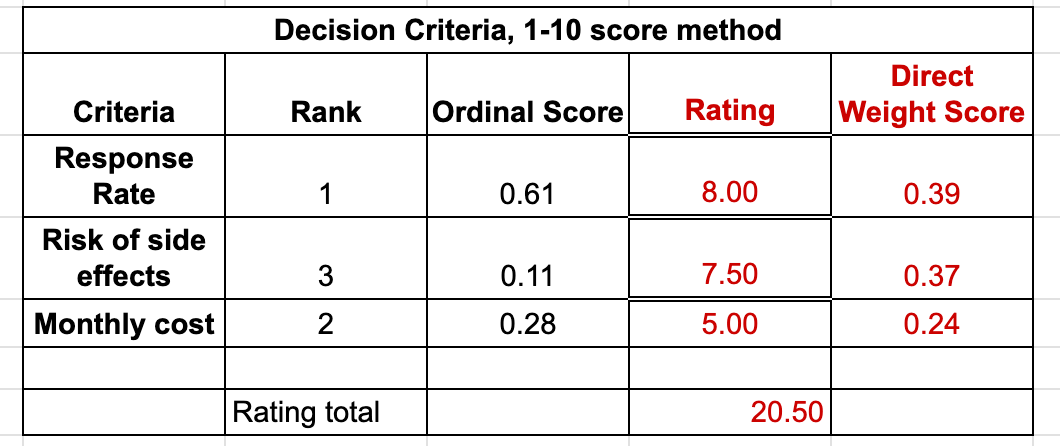
Now let’s assume that our example patient does not agree with these rank-assigned weights. She and her physician therefore decide to use direct weights to adjust them to more closely match her preferences. There are several ways to do this. A common method is to rate the items on a 1-10 scale and then normalize the results by dividing each rating by the sum of all ratings. An example rating process for the options relative to the Response Rate criterion is shown in the following table:

The same procedure is then used to assign priority scores to the decision criteria in terms of how important they are in achieving the goal of the decision:

The analysis is completed using the same method as with ordinal ranking scores. After the options have all been compared relative to the criteria and the criteria compared relative to the goal, overall scores are calculated for each option by multiplying the option criteria weights times the criteria priorities and summing the results, a procedure similar to calculating a weighted average. To make it easier to review and discuss the scores, the scores are multiplied by 100 to remove the decimal places. (See details in the April 28, 2023 Musing.)

If you would like to explore the direct weighting procedure further, I’ve made a Google Sheets file that will do the direct weighting for the example problem. It can be assessed using this link, I hope. If you have problems accessing it, please send me a comment and I will try to fix it.

Musings

Like the ordinal rank weighting methods, the direct weighting method is easy to use and can be programmed into any spreadsheet, so can be implemented quickly and easily. The direct weighting method shares the advantages of the ordinal ranking method but, in addition, can more accurately reflect a decision maker’s decision preferences and priorities than is possible using ordinal rank weights.

In some cases the additional information provided by this analysis will provide enough information to help decision makers reach a decision. If not, the BCDMF provides two additional modules that take a different approach to analyzing a decision that can provide additional insight into a complicated decision making scenario. I will describe these in upcoming Musings. 

References

1. Dolan JG. Multi-Criteria Clinical Decision Support: A Primer on the Use of Multiple-Criteria Decision-Making Methods to Promote Evidence-Based, Patient-Centered Healthcare. The Patient: Patient-Centered Outcomes Research. 2010 Dec;3(4):229–48.

The Busara Clinical Decision Making Framework Deliberative phase – Part 1

Ordinal ranking

The Busara Clinical Decision Making Framework (BCDMF) deliberative phase is designed to be used when decision makers are not ready to make a decision after examining the data and tradeoffs intuitively. Use of the deliberative phase should be considered anytime decisions present difficult tradeoffs and/or when making high stakes decisions, particularly those that cannot be reversed, such as having surgery. 

The BCDMF is based on multi-criteria decision analysis (MCDA). MCDA is designed to help people make better choices when decisions involve tradeoffs between competing decision objectives, a characteristic of many medical decisions.

There are a number of well developed MCDA methods. They all use the same basic decision model but differ in the method used to identify preferred alternatives. A nice feature is that the methods can progressively build on each other, so it is possible to increase the complexity of an analysis without needing to start over. [1]

The MCDA methods included in the deliberative phase of the BCDMF work by creating quantitative scales that reflect decision makers judgments about how well the options meet the criteria and the priorities of the criteria relative to the goal. These scales help characterize the judgments being made in the decision making process more exactly than possible using qualitative terms or intuitive feelings. They therefore provide a new and enhanced way for decision makers to communicate with each other about their preferences and priorities. They also enable decision makers to explore how changing their initial preference and priority judgments affects the overall assessments of the options under consideration. 

The methods included in the Busara Clinical Decision Making Framework are listed in the following table. They can be applied to both assessing the relative priorities of the decision criteria and how well the options meet the criteria. 

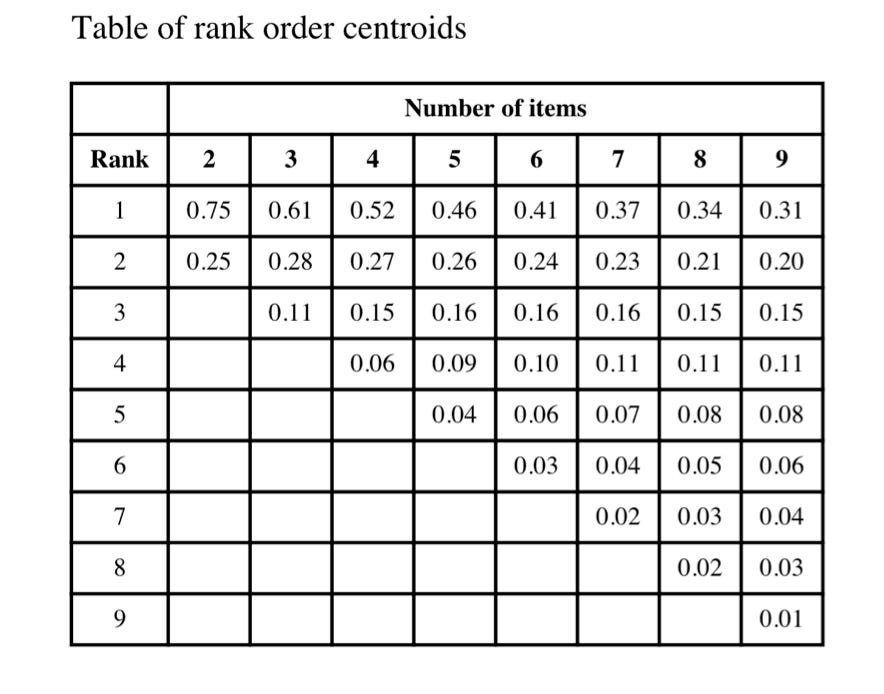
The simplest method, rank order, assigns values to decision elements based on their ordinal rank order using a method called rank order centroids, a  measure of the distance between adjacent ranks on a 0 to 1 normalized scale. [1,2,3] Rank order centroids can be calculated directly, but pre-calculated tables , like the one shown below, are readily available.

To use the method, the decision maker(s) orders the items being compared from best to worst and then assigns the appropriate rank value. If there are ties, the average of the values for the tied values are used.

To illustrate, suppose a doctor and a patient are choosing among 3 possible treatment options. They create the following decision model and then obtain information about how well the alternatives meet the criteria and summarize it in a decision table:

Unsure which treatment is best, they rank order both the importance of the three criteria and how well the three options meet each criterion. Once completed, they  assign the appropriate rank order weights. As shown in the rank order centroid table, with three items, the value assigned to the highest ranked item is 0.61. The values for the 2nd and 3rd ranked items are 0.28 and 0.11.

In this example, as in most real world decisions, the priorities of the decision criteria are subjective judgments. Because the data showing how well the options meet the criteria are all quantitative in the example, they are easy to rank order. It is also possible to include criteria that are not assessed quantitatively. For these criteria the rank ordering is done subjectively, like the criteria priorities. 

The results of the example ranking process are shown in the following two tables:

The analysis is completed by creating overall scores for each option by multiplying the option criteria weights times the criteria priorities and summing the results, a procedure similar to calculating a weighted average. To make it easier to review and discuss the scores, the scores are multiplied by 100 to remove the decimal places:

The results show that Option B is the best with an overall score of 42, followed by A and then C. If, on the other hand, Risk of Side Effects was ranked most important and Response Rate second, the best choice is C with a score of 43, followed by A (score = 32) and B (score = 25).

Musings

This method is easy to use and can be programmed into any spreadsheet, so can be implemented quickly and easily. In addition to ease of use, its main advantages are that the rankings and ranking scores give decision makers a new language to discuss and compare their decision priorities and explore how different priorities would change the option scores. Its main disadvantage is the fixed nature of the rank values may not accurately reflect decision maker’s judgments about the magnitude of the differences between the options and criteria.

In some cases the additional information provided by this analysis will provide enough information to help decision makers reach a decision. If not, it serves as the foundation for additional deliberative procedures that will provide increasing amounts of information about decision judgments and priorities that I will review in future Musings.

References

1. Dolan JG. Multi-Criteria Clinical Decision Support: A Primer on the Use of Multiple-Criteria Decision-Making Methods to Promote Evidence-Based, Patient-Centered Healthcare. The Patient: Patient-Centered Outcomes Research. 2010 Dec;3(4):229–48.

2. McCaffrey JD. Using the Multi-Attribute Global Inference of Quality (MAGIQ). Technique for Software Testing 2009;2009:738–742.

3. Edwards W, Barron FH. SMARTS and SMARTER: Improved Simple Methods for Multiattribute Utility Measurement. Organizational Behavior and Human Decision Processes 1994;60(3):306325.

Using Decision Dashboards to guide clinical decisions.

The Busara Clinical Decision Making Framework Intuitive Comparison format

What information visualization is really about is external cognition, that is, how resources outside the mind can be used to boost the cognitive capabilities of the mind. ~ Stuart Card

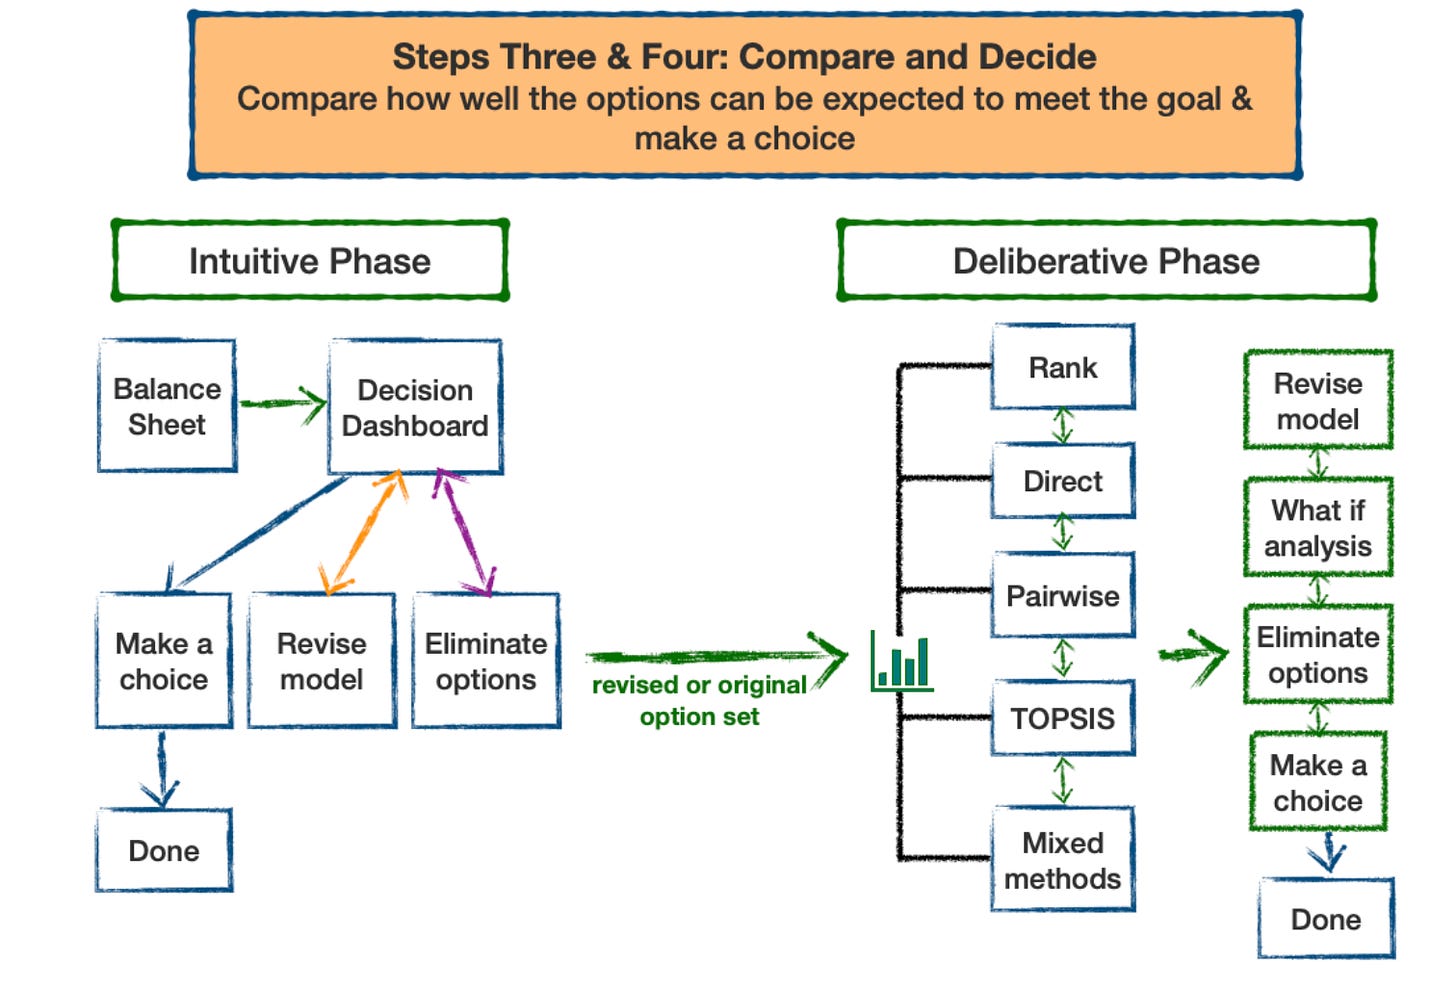
Good decision makers, particularly in applied settings, learn how to effectively combine both approaches to take advantage of the strengths and minimize the weaknesses of each. [4] Supporting combined intuitive and deliberative decision making is also an attribute of successfully implemented decision support systems. [5] This is the approach taken in the Busara Clinical Decision Making Framework (BCDMF).

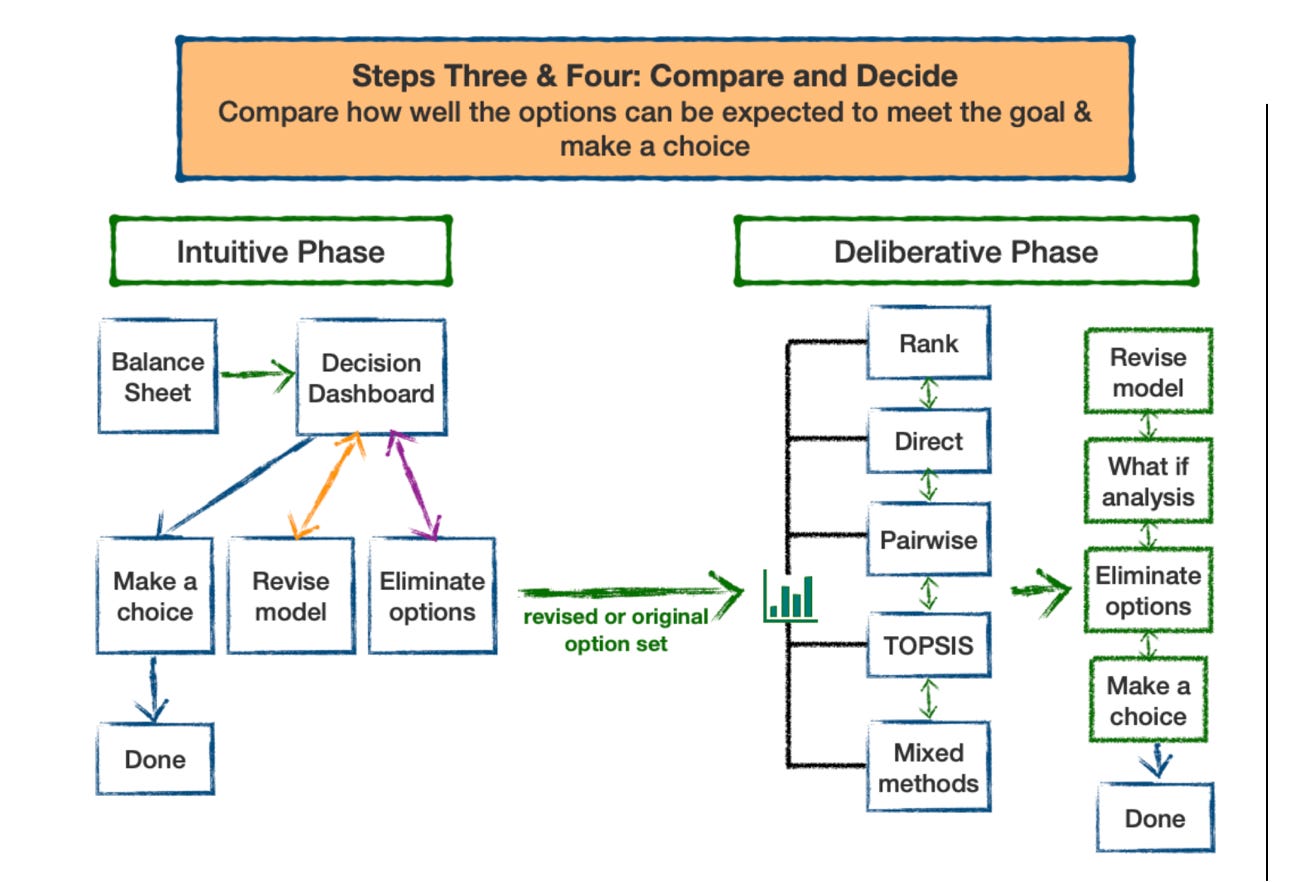
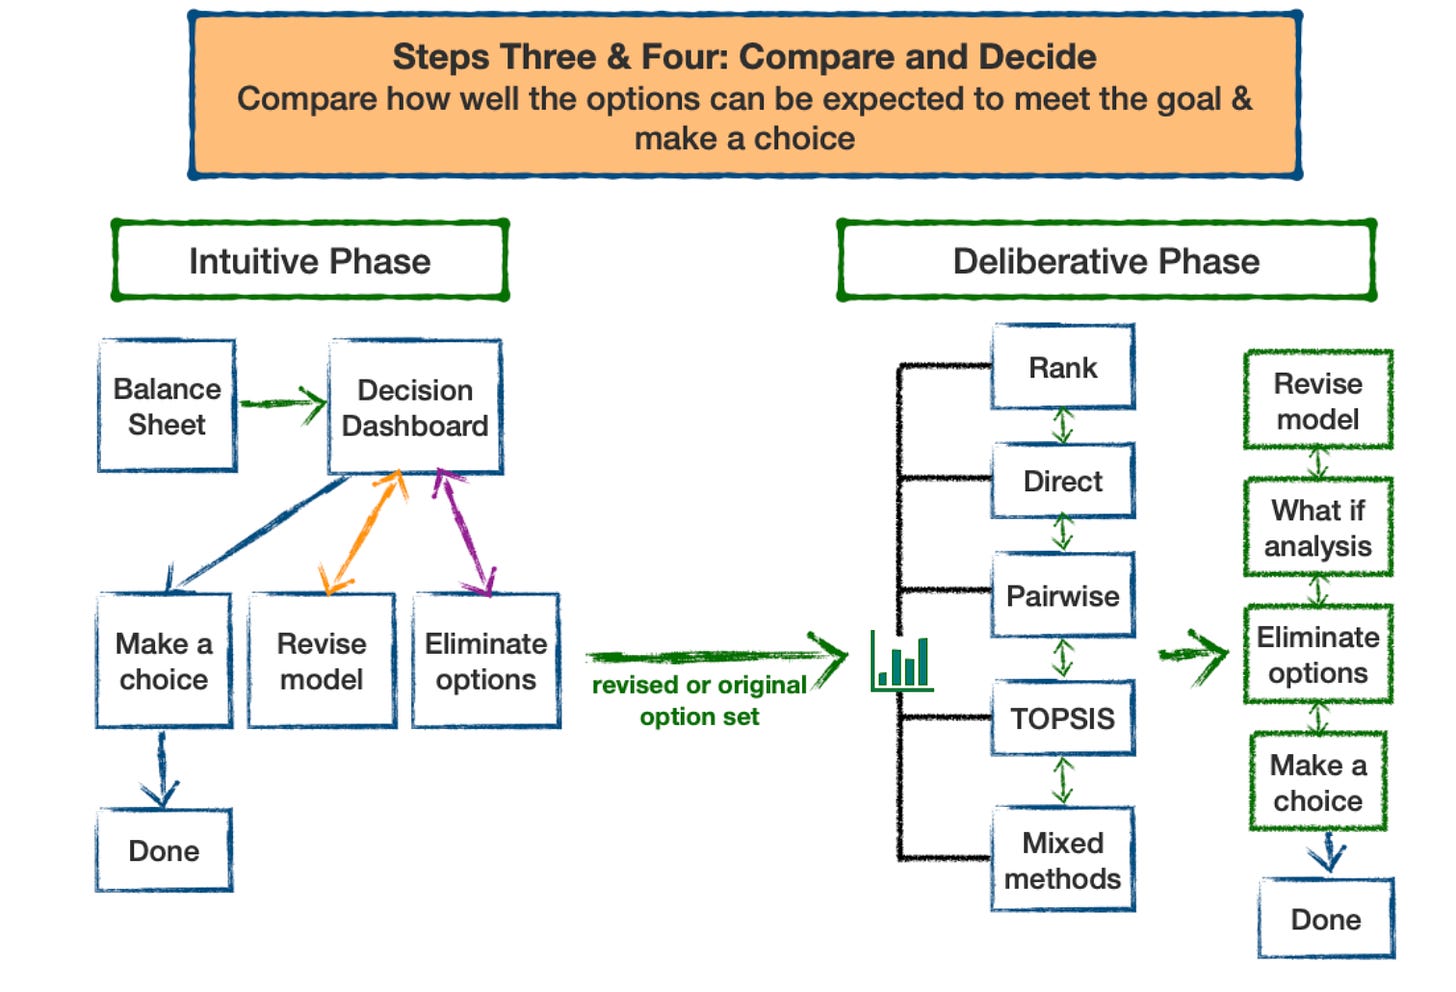
As shown in the figure below, the Comparison and Decide phase of the BCDMF starts with an intuitive phase and then transitions to a deliberative phase if necessary:

I reviewed how to construct and prepare interactive decision dashboards in the March 31, 2023 and April 7, 2023 Musings. Today, I review how they can be used in the BCDMF using a decision dashboard created several years ago comparing options for initial treatment of newly diagnosed, localized prostate cancer. Please note that the data included in the prostate dashboard are old and may not be up to date. Therefore it should be considered an illustration and should not be relied on to make any actual treatment decisions.

Management of newly diagnosed prostate cancer (NDPD)

There are multiple ways to manage NDPD. The four most common are active surveillance (monitoring the course of the disease without intervening), surgery, external beam radiation, and brachytherapy (implanting radioactive pellets in the prostate gland). None of these strategies is clearly better than the others. Therefore the choice of management depends on trade offs between their advantages and disadvantages. At the time the dashboard was created, there was considerable uncertainty about the data regarding the outcomes to be expected with each option. It was therefore important to make clinical decision makers aware of the uncertainties that exist and factor them into their decision making process.

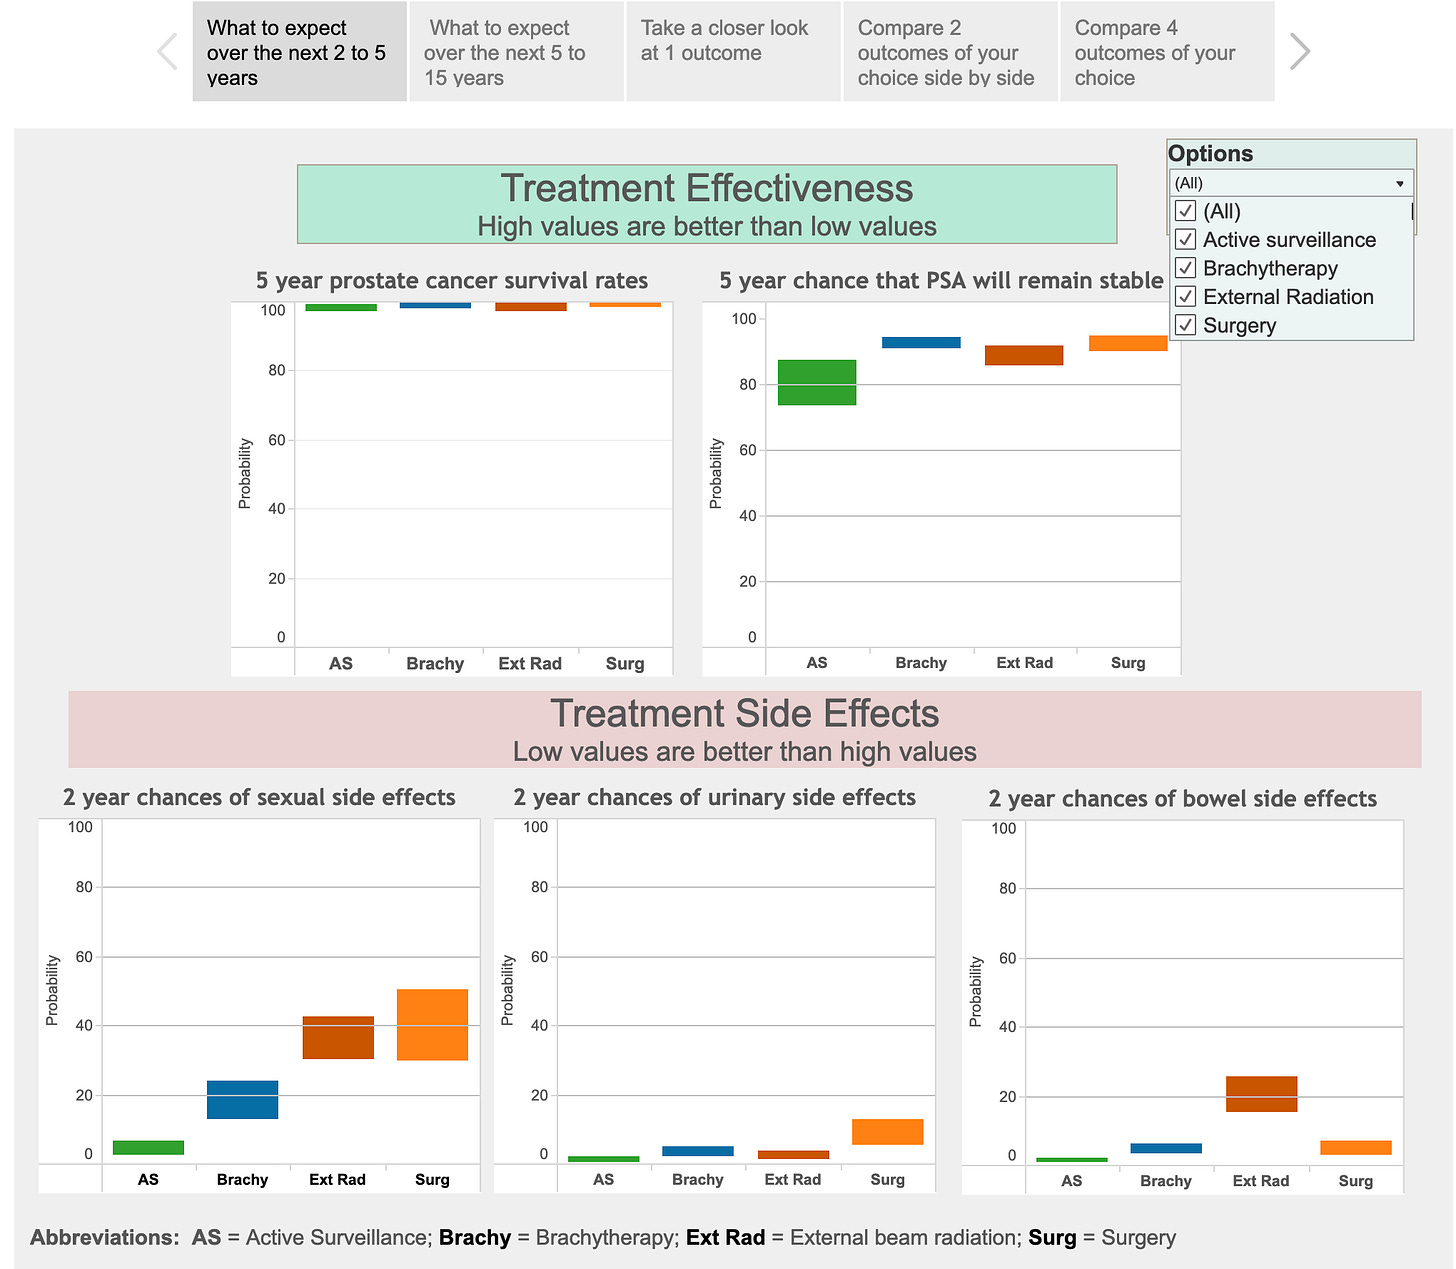
The dashboard developed for men with low risk NDPD is shown below – the link to the interactive version is here.

The dashboard is designed to help people compare the short and longer term benefits and risks of the management options. Benefits are divided into survival rates and the chances that the prostate cancer will not progress. The dashboard also lists information about the three major risks of the management options: sexual, urinary, and gastrointestinal problems. Separate sections of the dashboard are devoted to short term outcomes over the first 5 years and longer term 5 to 15 year outcomes. Users can select which options to display using the menu at the upper right. The menu across the top allows users to select short or long term data and take closer looks at one, two, and four selected outcomes.

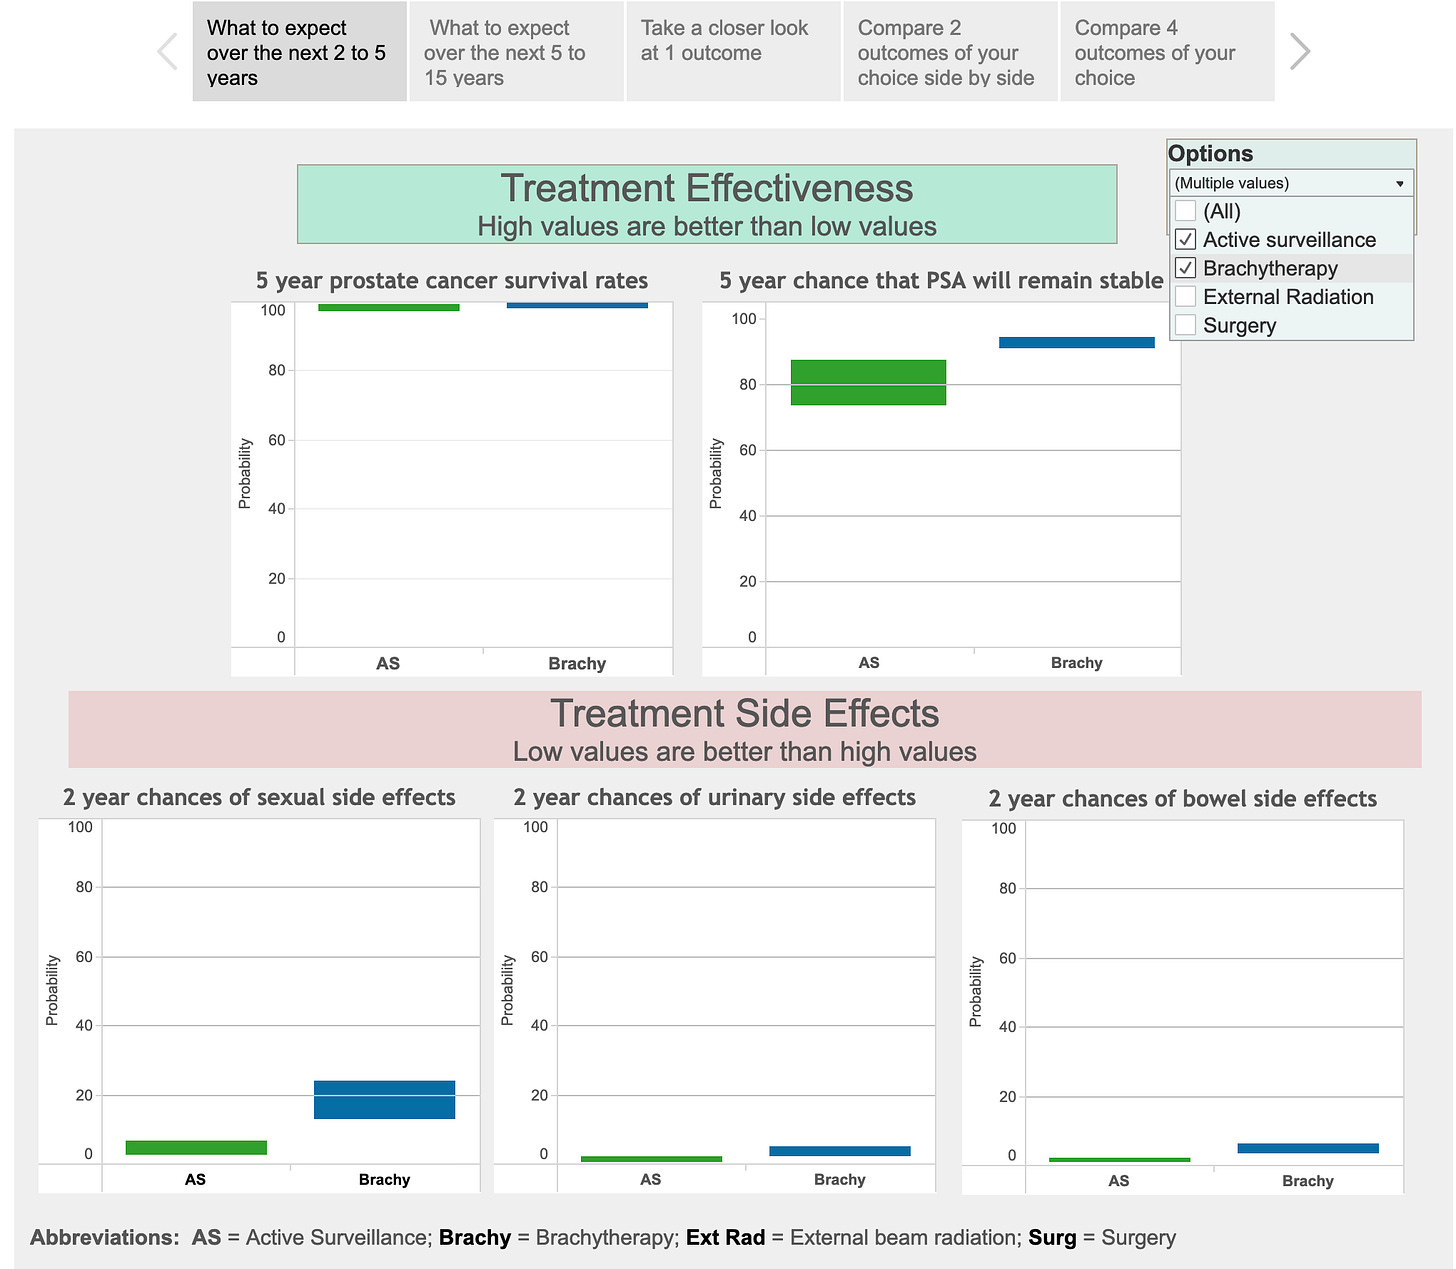
One way to use the dashboard is to decrease the number of options by eliminating options that are not desirable based on one or more of their attributes. For example, since the advantages of surgery and external beam radiotherapy are not that different from active surveillance and brachytherapy, one could eliminate them from consideration based on their higher risks of side effects by unchecking them in the options selection panel on the upper right. The resulting dashboard allows one to concentrate on comparing the pros and cons of the two remaining options. See the figure below:

For some, a process like this may be all that is necessary to select a preferred option. Others may want to factor in considerations that were not included in the initial dashboard. In this case, either the initial dashboard would have to be revised to include the new considerations and then reexamined or the decision making process continued without including the new factors in the dashboard display.

Another possibility is that a patient is not yet ready to choose a preferred treatment due to difficulty making one or more of the necessary tradeoffs. In this case, the decision making process would move on to include one or more deliberative decision making methods to help resolve the impasse. I will start to outline how this process could work in the next few Musings.

References

1. Ayal, S., Rusou, Z., Zakay, D., & Hochman, G. (2015). Determinants of judgment and decision making quality: The interplay between information processing style and situational factors. Frontiers in Psychology, 6. https://doi.org/10.3389/fpsyg.2015.01088

2. Kahneman, D. (2003). A perspective on judgment and choice: Mapping bounded rationality. The American Psychologist, 58(9), 697–720. https://doi.org/10.1037/0003-066X.58.9.697

3. Tversky, A., & Kahneman, D. (1974). Judgment under Uncertainty: Heuristics and Biases. Science, 185(4157), 1124–1131. https://doi.org/10.1126/science.185.4157.1124

4. Duke A. Thinking in Bets: Making Smarter Decisions When You Don’t Have All the Facts. New York: Portfolio; 2018.

5. Wu HW, Davis PK, Bell DS. Advancing clinical decision support using lessons from outside of healthcare: an interdisciplinary systematic review. BMC medical informatics and decision making. 2012;12(1):1–10.

The Busara Clinical Decision Making Framework, Step 2: Gather

In recent Musings, I’ve discussed introducing the concepts of a working decision model and decision dashboards to promote high quality decision making in routine clinical practice. In addition to being stand-alone interventions, they can also be parts of a comprehensive decision support system designed to effectively incorporate simple and sophisticated decision making techniques into busy practice settings. 

I’ve developed a preliminary outline of how this could be accomplished called the Busara Clinical Decision Making Framework (BCDMF). (Busara is a Swahili work meaning “practical wisdom”; I picked this term because I believe it makes sense to adapt established knowledge and tools for practical uses.)  The Busara Clinical Decision Making Framework (BCDMF) is designed to provide a powerful but flexible decision making tool that both meets the needs of clinical decision makers and is feasible for clinical use. It is based on the premise that a clinical decision support system should be readily adaptable to meet the needs of clinical decision makers: sometimes only a simple version is needed; at other times a detailed, in-depth version is called for.  

There are four basic steps in the BCDMF:

Plan: Define the decision goal, options, and criteria that will be used to judge how well the options meet the goal. Then use these decision elements to create a diagram called a decision model that will serve as a map to guide the decision making process. 

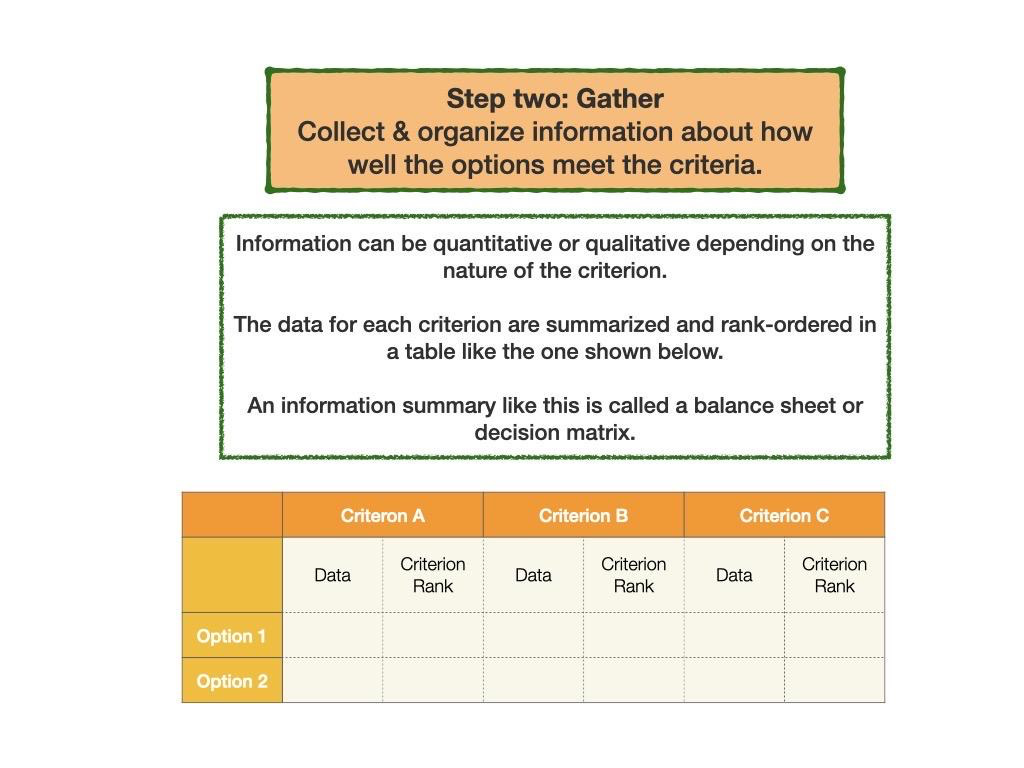
Gather:  Gather and summarize information about how well the options meet the decision criteria.

Compare: Use the information collected to compare how well the alternatives are likely to meet the goal.

Decide: Make a choice.

I’ve discussed the use of decision models in the February 24, 2023 and March 24, 2023 Musings. Today I’d like to expand on the BCDMF Step 2 – the Gather phase.

The decision making task is to identify the option that best meets the factors that have been identified as important in making the choice during the creation of the decision model. These factors serve as criteria to judge how well the options are likely to meet the goal. The Gather phase of the BCDMF consists of gathering and summarizing information about how well the options meet each of the decision criteria.

The data gathered are summarized using a table called a decision matrix or balance sheet – see the example below. Ranking each option according to how well it is likely to meet each criterion is an extra step but a useful way to start to make sense of the information that has been gathered that sometimes can by itself be sufficient to drive a decision.

The initial goal is to gather as much information as possible easily and quickly. If necessary – and time and resources allow – this initial data set can be further refined as needed after an initial analysis.

For example:

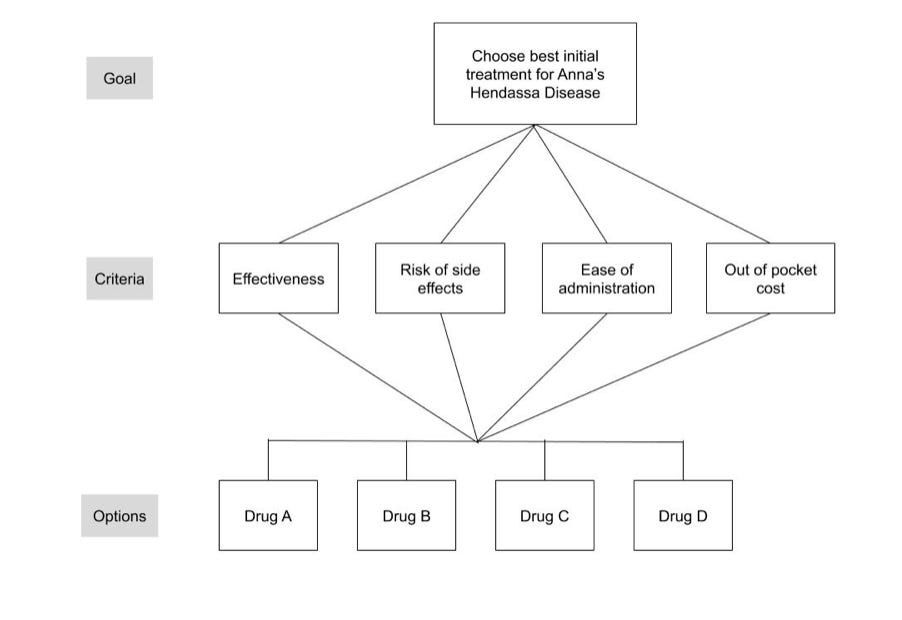
Suppose a doctor and a patient are choosing among 4 drug treatment options to treat a fictitious illness called Hendassa Disease.

First they create the following decision model:

They then obtain information about how well each drug meets each criterion and summarize it in the table shown below:

Musings

To be useful in the clinic, the basic information needed to create a decision table needs to be collected beforehand and readily available. There is a clear need for creating summary tables that, as far as I know, is not being met by current medical textbooks, journals, or other sources of information. The best resource I am aware of is the Option Grid project [1], but it appears they are no longer available on the Internet based on a search I did on April 12, 2023.

As I mentioned last week, it would be terrific if guideline developers started distributing decision tables suitable for rapid clinical use, along with the rest of their materials. This would also be an welcome addition to the information provided in regularly updated sources of information like Up-to-Date. If anyone knows of any sources of decision tables or similarly formatted information please let me know by entering a comment.

Even is such resources are available, it is important to make sure the information provided is up to date, accurate, and appropriate for each individual patient. (This is particularly a problem if costs are included, as I think they reasonably should be.) This situation suggests that information resources would need to be managed at the local or regional health center level working with a wider organization.

Reference

1. Elwyn G, Lloyd A, Joseph-Williams N, Cording E, Thomson R, Durand MA, et al. Option Grids: shared decision making made easier. Patient Educ Couns. 2013 Feb;90(2):207–12.

How to create a simple decision dashboard in Tableau Public

There are many excellent ways to create interactive decision dashboards. I chose Tableau for last week’s illustration because I had already created the dashboard as part of an earlier project, it is a format that is easy to distribute over the Internet, and the Tableau Public site has a lot of information and examples of interesting data visualizations.

To follow last week’s dashboard demonstration, I thought it would make sense to illustrate how to create one. Unfortunately I couldn’t replicate what I did several years ago to create last week’s dashboard (I haven’t figured out why), so I had to make a new one. Here is what I did.

Tableau Public illustrations can either be created online or using a downloaded copy of the Tableau Public Software. As far as I can tell, the process is the same. All files created with either method will be saved to the Tableau Public site and potentially available to everyone.

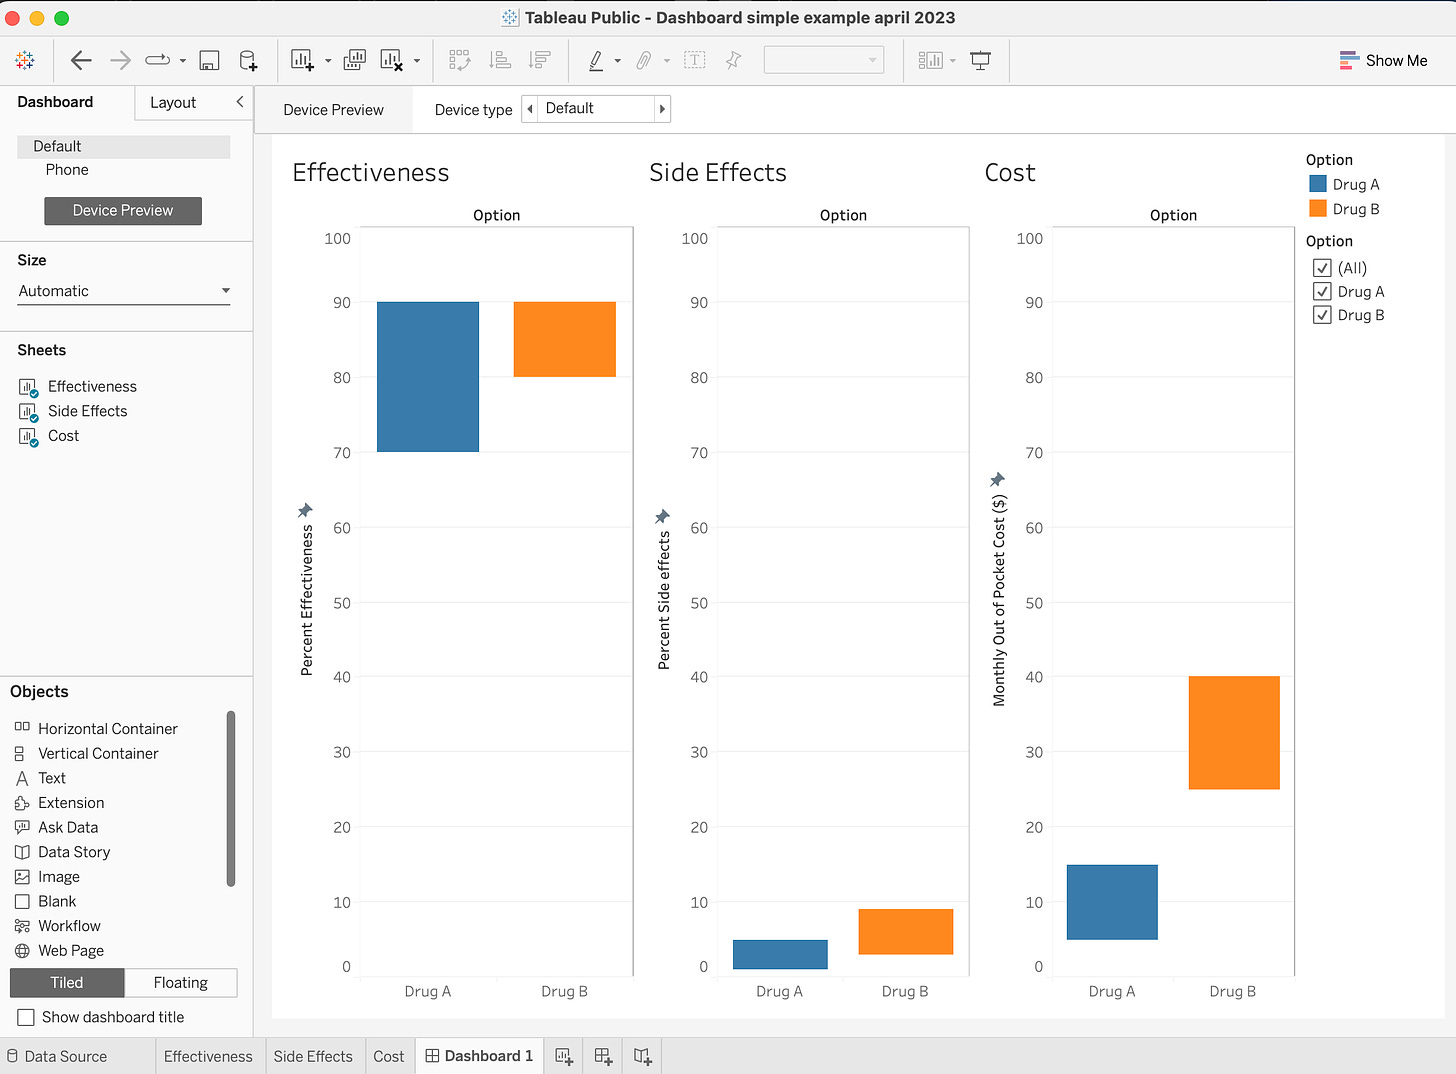
The figure below shows the dashboard I built for this illustration. The online version can be accessed using this link.

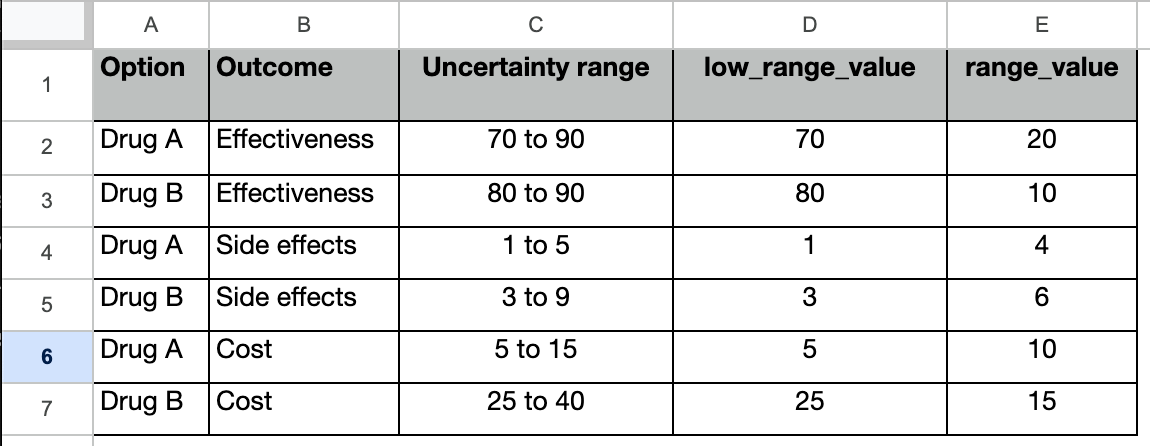
The first step is to collect the data that will be used for the dashboard. The simplest way to do this is to add the data to a spreadsheet that is then saved as an Excel file. This can be done with many programs including Excel, Google Sheets, Open Office, and Apple Numbers. Here is a copy of the data I used to build the sample dashboard, using a file created in Google Sheets and subsequently downloaded as an Excel file:

Note that the Uncertainty Range field is not used in the final dashboard, but I think it is helpful to include it with the dashboard data.

The next step was to open a new file in Tableau Public and connect the dashboard data file. Just click on the “Connect to Data” link and follow the instructions.

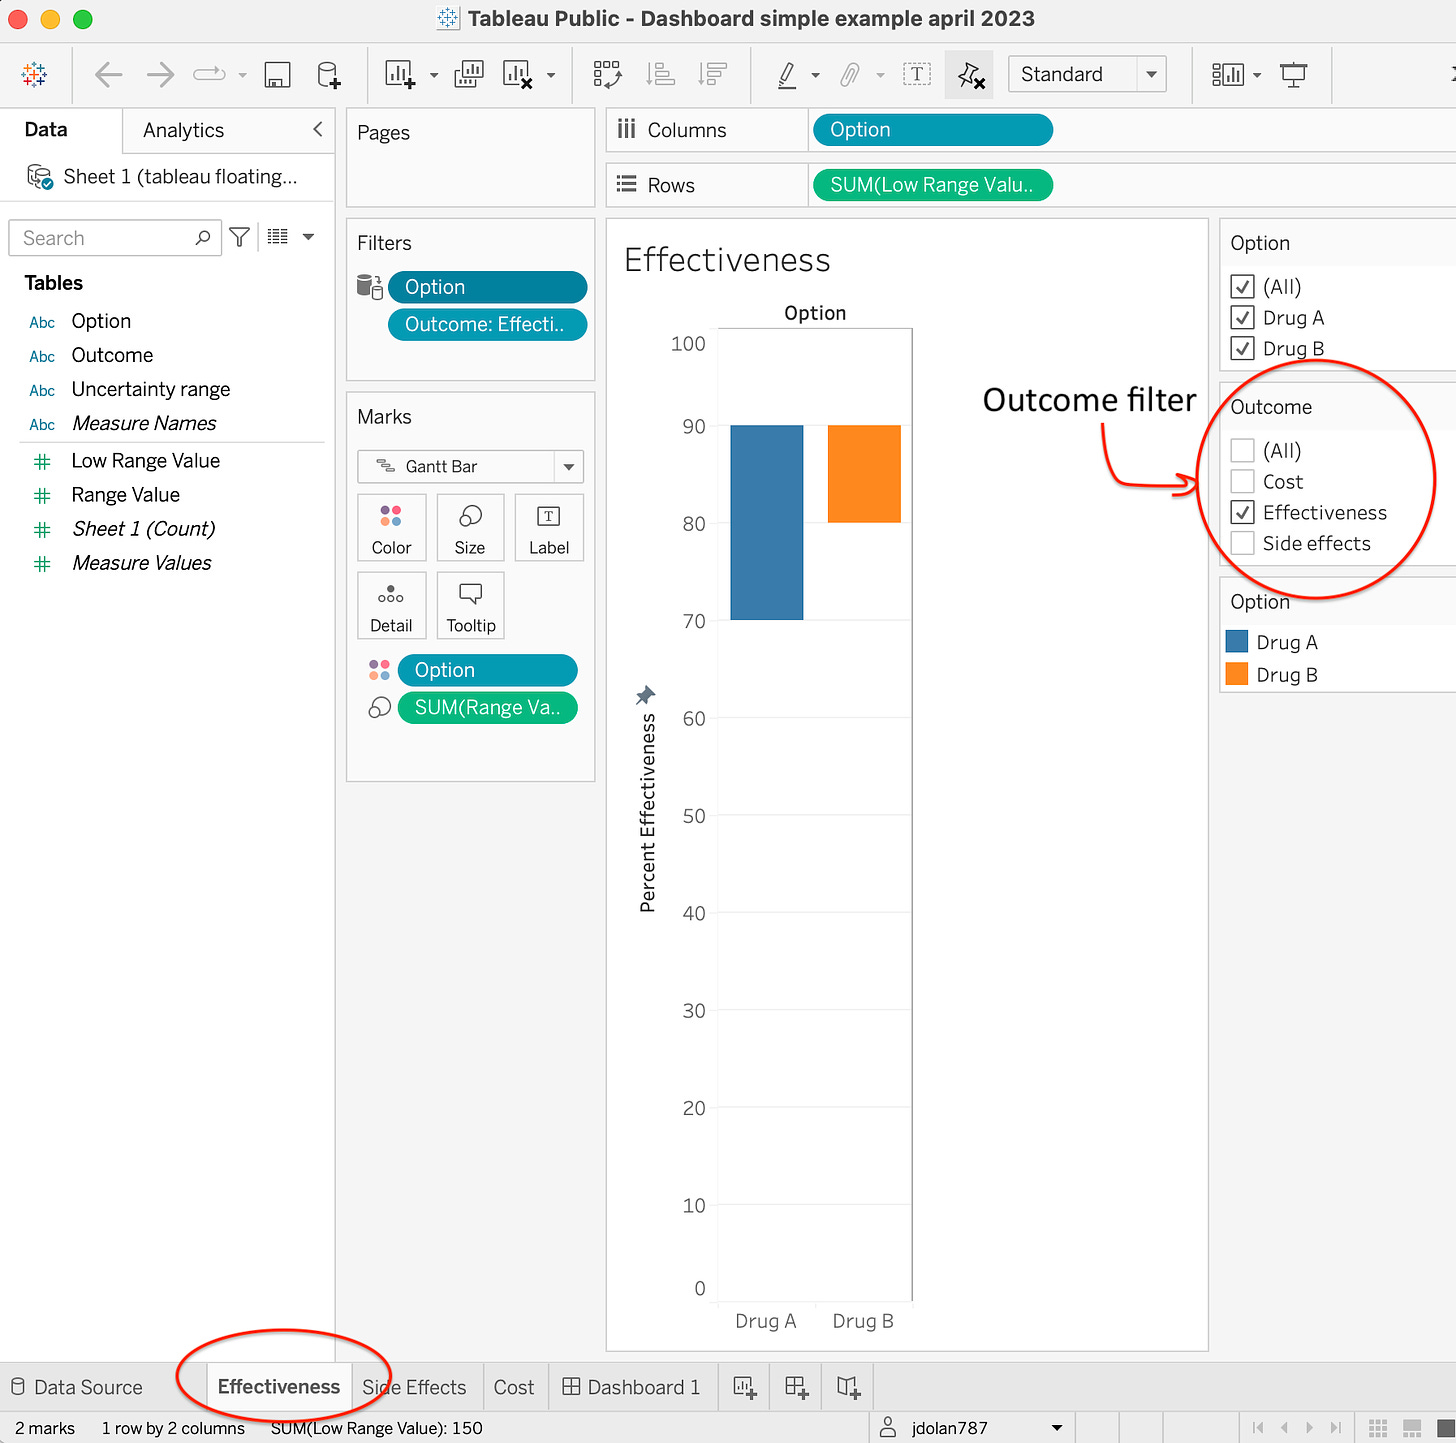
Once the data were uploaded, I created a chart for the outcome Effectiveness as follows. (Note that “Sheet 1” opens by default):

◦ Move Option to the columns shelf, and the value low_range_value to the row shelf.

◦ Move Outcome to the Filter area, select Effectiveness.

◦ Add Option to the Filters, right click on it and select show filter. It will appear on the upper right. (This allows one to delete one or both of the options from the display.)

◦ Change the Marks Area to Gantt Bar.

◦ Move Option to the Color box.

◦ Move range_value to the Size box.

◦ Right click on the Y axis, change it to fixed, 0 to 100; and the title to “Percent Effectiveness”.

◦ Right-Click on the “Sheet 1” tab at the bottom and rename “Effectiveness”.

The result of these steps is shown below:

The next step was to duplicate this process for the other two outcomes. It is easy. Just right-click on the “Effectiveness” tab and select duplicate. Switch to the new tab and rename it “Side effects”; then uncheck Effectiveness and check Side effects in the Outcome filter on the right side of the display. Once done, repeat the process for Cost.

The last step is to create the dashboard. Select new dashboard from the Dashboard tab at the top of the display. Next:

– Select automatic in the Size option box.

– Drag the 3 sheets into the display area.

– Adjust their sizes so they are equal.

– Click on the Effectiveness area, mark “Use as filter” in the upper right.

– Click on the Outcome and Option filters, go to other options and select “remove from dashboard”.

The result is the dashboard shown in the first figure above.

Musings

If this tutorial illustration was helpful, please let me know in the comments. Also, feel free to post any questions there and I will do my best to answer them.

Interactive guideline decision models & dashboards

In last week’s post, I proposed that guideline creation panels start including decision models and dashboards in their guideline summaries and recommendations. I included an example decision model and dashboard to illustrate how this process could work. The dashboard I included has a couple of shortcomings. It is not interactive and does not show how uncertainties can be included in a dashboard display. The purpose of today’s post is to demonstrate the basic elements of an interactive decision dashboard.

Today’s technology makes it easy to build and disseminate complex, interactive dashboards and other information visualizations of all types. One of the best resources to learn about these capabilities is Tableau Public. Users of this site can explore information visualizations about many topics and learn how to create and post their own. Use of the Tableau Public site is free but all visualizations are open to public access. Licenses for the Tableau software can be purchased for proprietary use.

I used the Tableau Public site to create a simple interactive dashboard regarding the following decision:

Imagine you have a newly diagnosed chronic disease that is causing symptoms severe enough to limit your daily activities. Fortunately,  several treatment options are available. Information about how well they work, their risk of side effects, and monthly out-of-pocket cost is summarized in the table below:

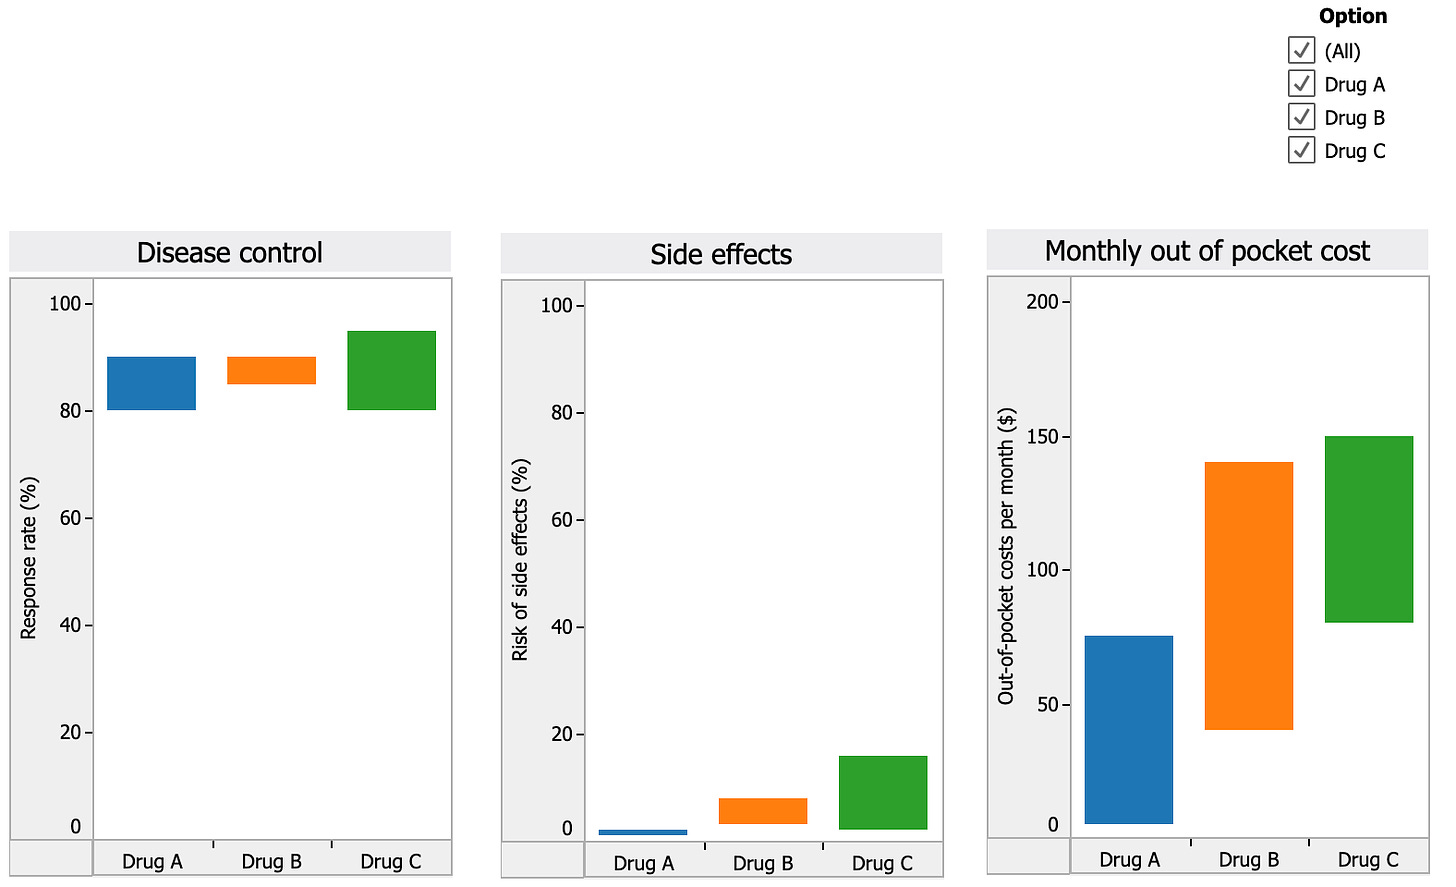
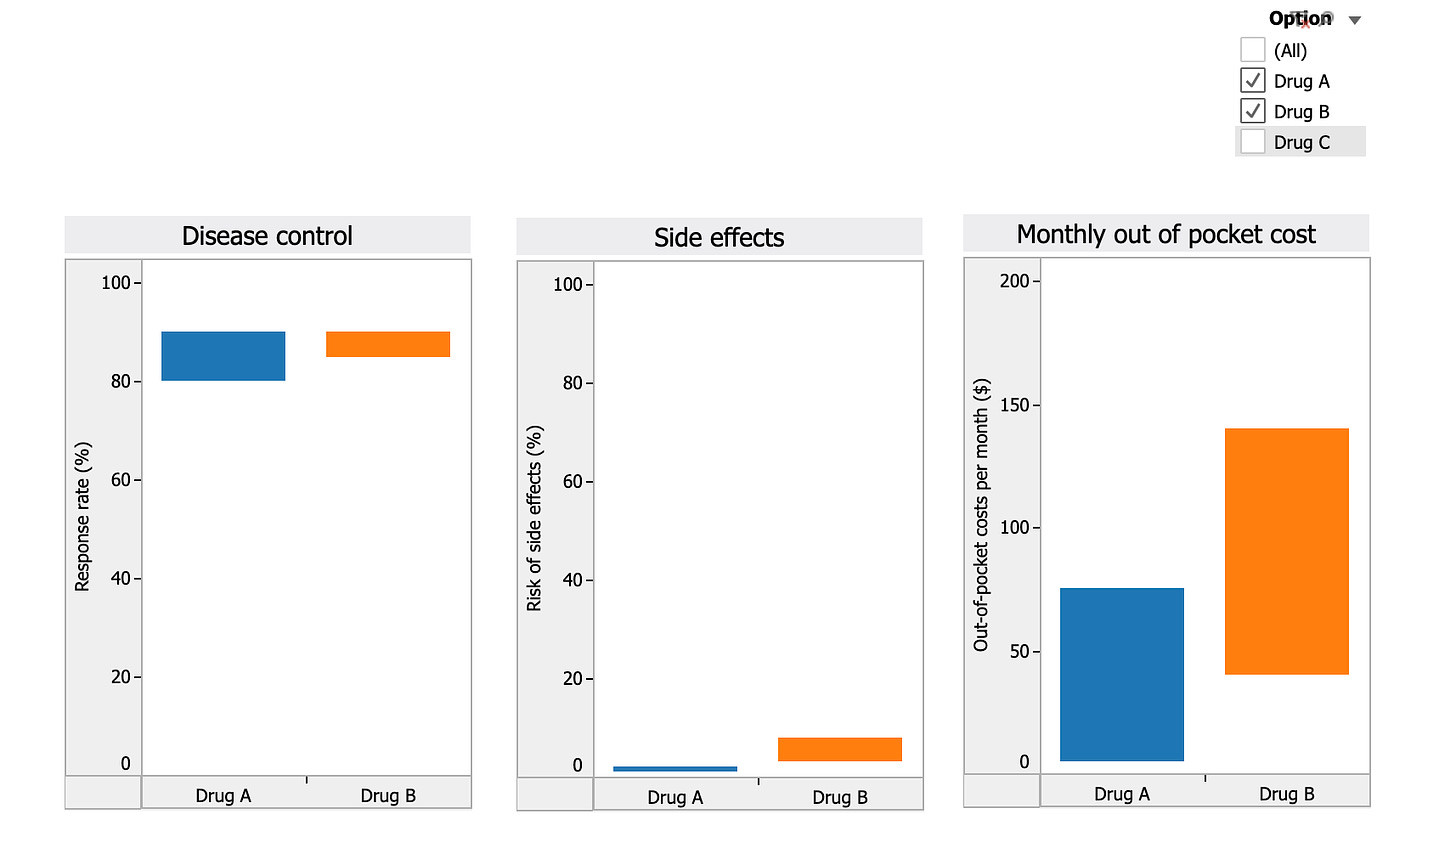
The goal of a decision dashboard is to help you compare the three drugs and choose the one that you would pick to treat your symptoms. A dashboard using the information in the table that compares the 3 drugs is shown below. Note, if you want to choose which drugs to display, use the checkboxes on the upper right.

A screenshot of the dashboard is shown below. Click this link to access the working version.

The initial display compares how the three drugs compare over three different dimensions: disease control or effectiveness, risk of side effects, and out of pocket cost. The range of possible values are graphically illustrated in the different colored bars.

Some may find the default display sufficient to choose a preferred drug. For example, someone may not be able to afford more than $100 per month, which would eliminate Drug C and probably Drug B as well. They can quickly see, however, that Drug A is the safest drug and should be as nearly if not as effective as the other two, making it a good choice.

Others may choose to make a decision by first eliminating a less desirable drug and then reviewing how the remaining two match up. For example, someone might choose to eliminate Drug C due to its high cost and high risk of side effects compared to the other two drugs. They then uncheck the box next to Drug C on the interactive dashboard and concentrate on comparing the two remaining drugs across the three decision criteria as illustrated below:

Musings

Clinical guidelines summarize and evaluate existing data to recommend how it should be applied in clinical practice. Most guidelines as currently written summarize the research findings and list practice recommendations in great detail, sometimes across the span of two or three separate articles. This format does a good job of documenting the data supporting the recommendations but is not designed to make either the data or the recommendations readily usable to support decision making in clinical practice. A simple solution to this problem is to create a decision-ready summary of the guideline data and recommendations in the form of a decision model and interactive decision dashboard.

In addition to making the guideline information more readily usable, a recommendation-based decision model could also be used to collect the perspectives and judgments of diverse clinical decision makers. The model could be disseminated as a small, interactive file with questions regarding decision related trade offs and judgments, and a mechanism for modifying the basic model supplied by the guideline panel. Models adapted through clinical use could be saved and anonymously aggregated to provide important information that could be used to inform future iterations of the practice guidelines.

Knowing is not enough, we must apply

“I have been impressed with the urgency of doing. Knowing is not enough; we must apply. Being willing is not enough; we must do.” ~ Leonardo da Vinci


Atrial fibrillation (AF) is the most common arrhythmia in the general population. Anticoagulation to prevent embolic events is a key part of the management of patients with atrial fibrillation. For many years warfarin, a vitamin K antagonist, was the only anticoagulant option. The introduction of a group of direct acting anticoagulants has made the choice of treatment more complicated. Compared with warfarin the newer agents do not require frequent monitoring and are somewhat more effective and safer, but more expensive.

In the February 2023 issue of Medical Decision Making, Kathryn Martinez and colleagues published a brief report describing their analysis of how well physicians engaged patients with atrial fibrillation in shared decision making regarding the choice of anticoagulant. [1] Recorded conversations were evaluated for 7 key elements of shared decision making using a list first developed by Braddock and colleagues in 1999. [2] The authors found that physicians frequently omitted elements of the shared decision making process and, in particular, rarely assessed patient preferences. They concluded:

Multiple professional societies support informed decision making for anticoagulation in patients with AF. Data from these real-world encounters of physicians and patients making these decisions suggest informed decision making is largely not taking place. Use of decision aids to support anticoagulation decisions may facilitate more complete informed decision making.

Musings

This paper is well done and calls appropriate attention to an important, complex decision faced by patients with atrial fibrillation. However I wish it had done more. Many prior studies, including the seminal paper by Braddock that was the source of the study methodology, have found similar results. After more than two decades, I think it is firmly established that physicians do not engage patients in shared decision making as often as they should. The outstanding questions are what can be done about it and who should take the lead in fixing the problem.

Medical education institutions and organizations producing clinical guidelines are the two most obvious places where progress could be made. Medical curricula could be modified to include explicit training in decision making tailored to provide students a firm background in the practice of good decision making, but results will take time. The quicker approach is to adapt practice guidelines to include decision models populated with decision-focused summaries of the research data that was reviewed that support the guideline recommendations.

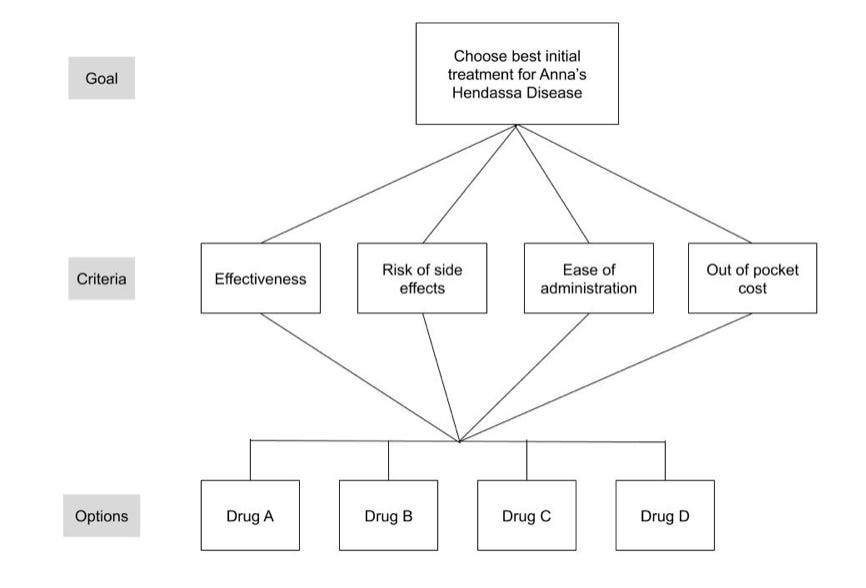
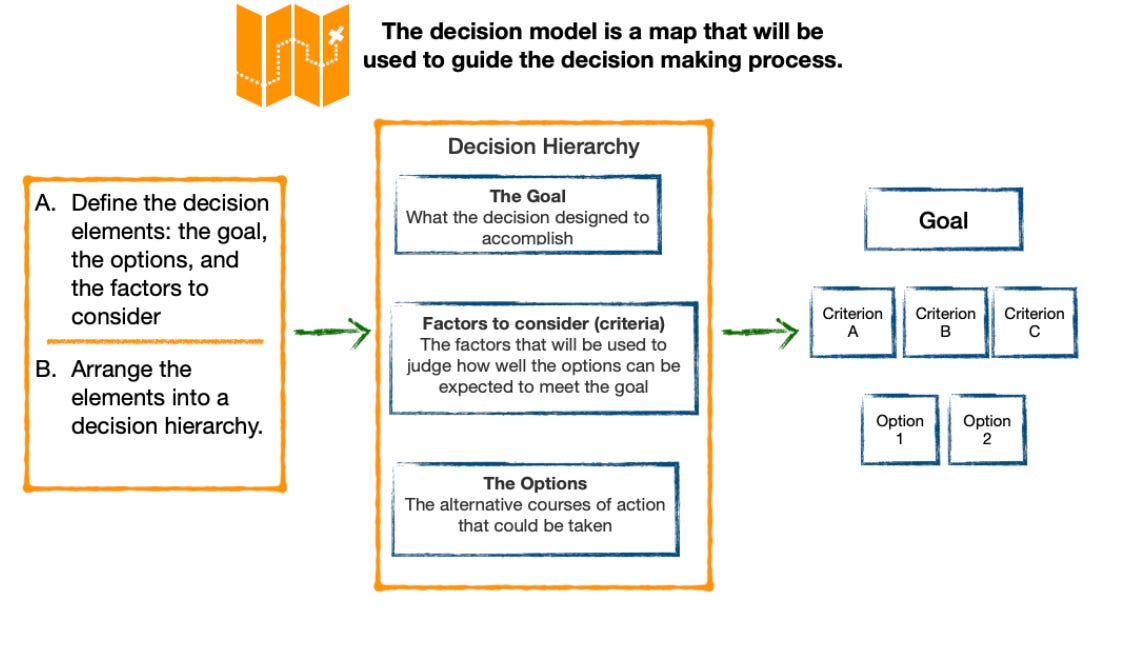
To illustrate, let’s consider what it would take to create a decision model alongside a clinical guideline. Imagine a guideline panel is meeting to issue guidelines for treatment of a fictitious condition called Hendassa Disease. After reviewing the literature, the panel has decided to endorse four drugs for clinical use: Drugs A,B,C, and D. In addition to a written summary of the data and their recommendation, they create a decision model for an illustrative patient called Anna. The design of a decision model is outlined in the first figure below, the illustrative patient model created by the guideline panel in the second.

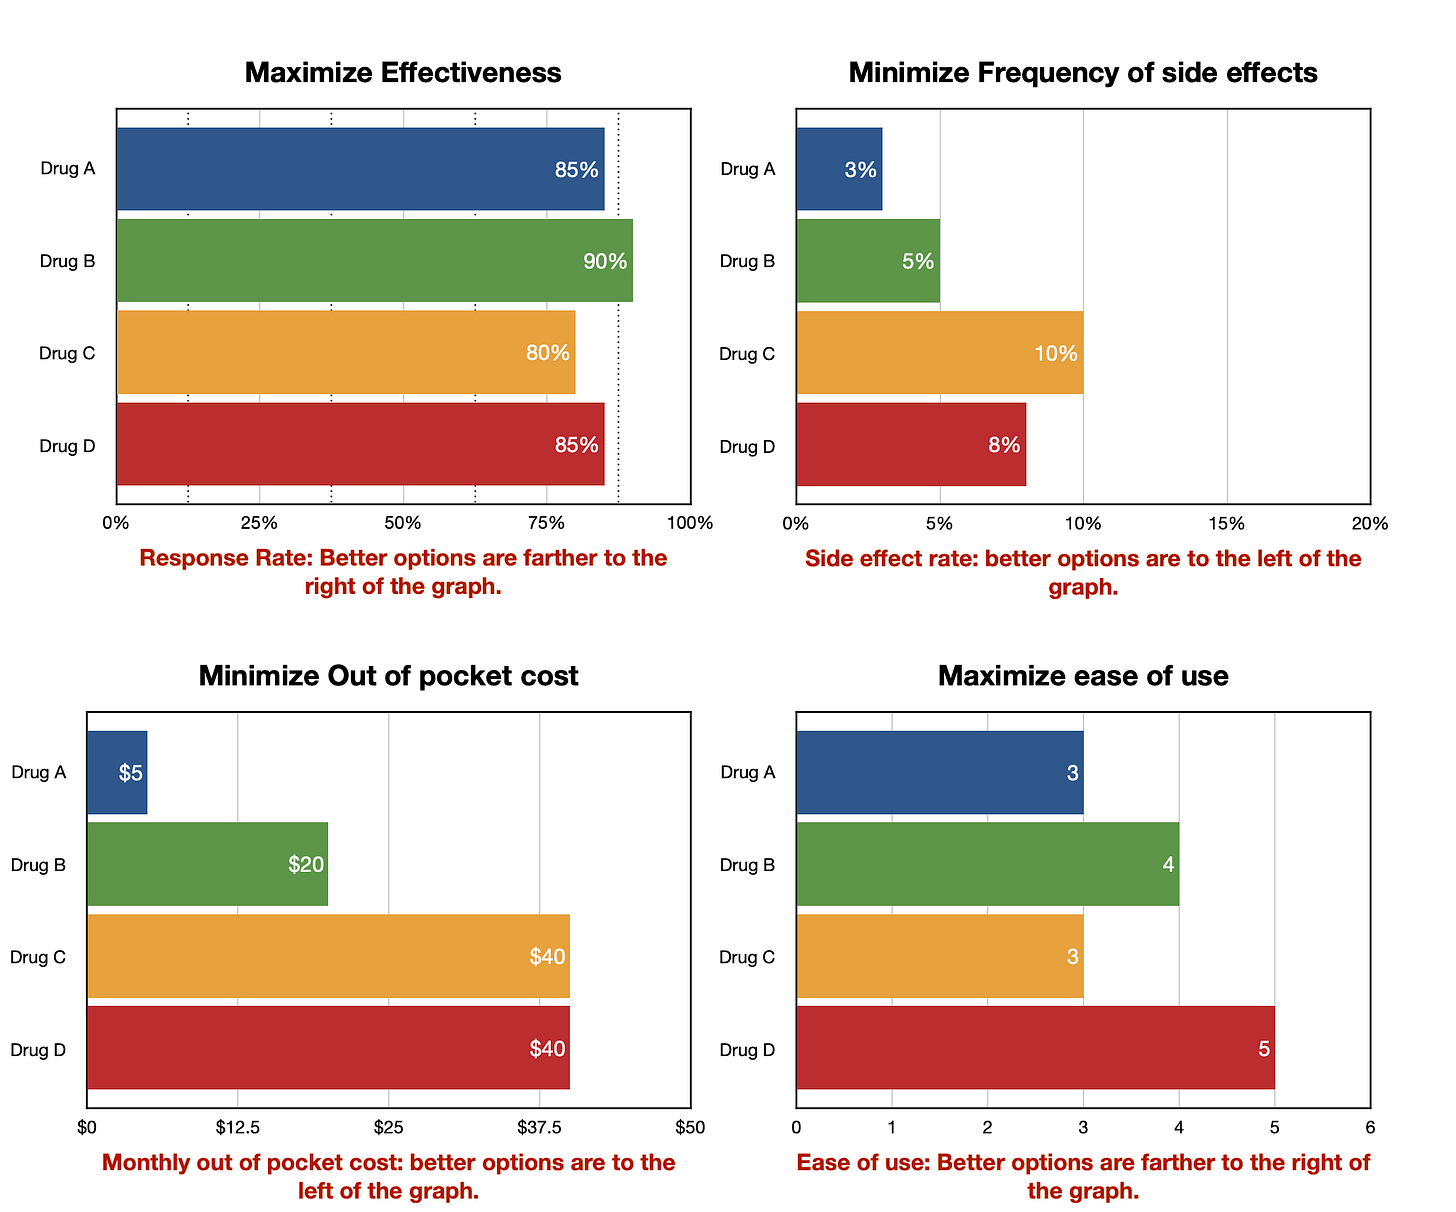
The next step for guideline developers would be to summarize information about the four treatment options in a manner that facilitates comparisons between their respective pros and cons. Ideally this would consist of a summary table and a corresponding decision dashboard. Examples of both formats are shown below. Note the dashboard has some example patient data input for this illustration. In practice, the guideline panel would leave this field empty, to be assessed by individual patients, as shown in the table.

This decision model and data summary would then be distributed along with the practice guidelines to provide clinicians with a ready-made platform for informing patients about the decision at hand and inquiring about their decision related preferences and values.

Creating a decision model and decision-oriented data summary like this could potentially increase the utility of guideline research and recommendations while requiring little additional effort by guideline panels. It seems to me someone should give it a try.

References:

1. Martinez, Kathryn A., Debra T. Linfield, Victoria Shaker, and Michael B. Rothberg. 2023. “Informed Decision Making for Anticoagulation Therapy for Atrial Fibrillation.” Medical Decision Making 43(2): 263–69.

2. Braddock III, C. H., Edwards, K. A., Hasenberg, N. M., Laidley, T. L., & Levinson, W. (1999). Informed decision making in outpatient practice: time to get back to basics. Jama, 282(24), 2313-2320.