The Busara Clinical Decision Making Framework Deliberative phase – Part 3 – Pairwise Comparisons

Review

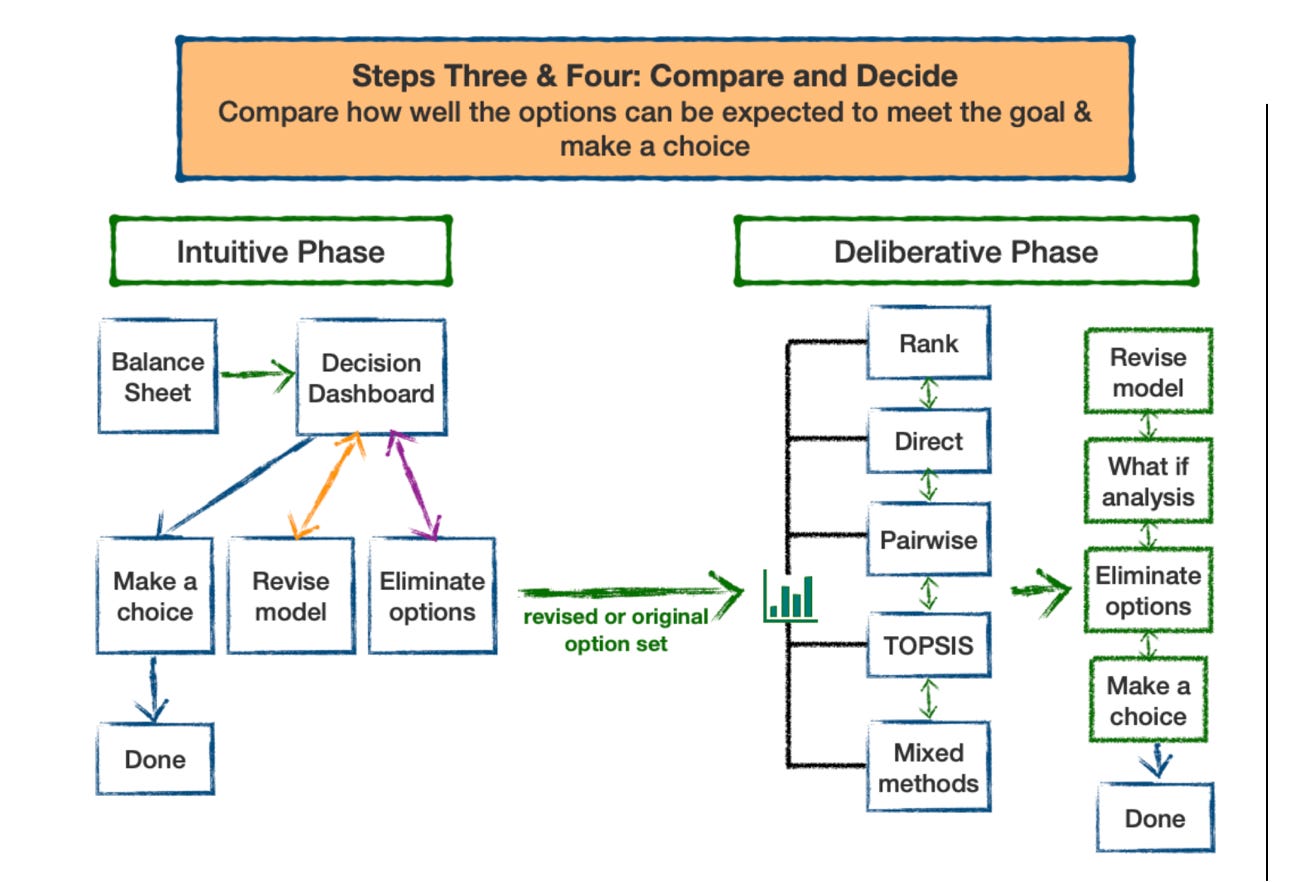
The Busara Clinical Decision Making Framework (BCDMF) deliberative phase is designed to be used when decision makers are not ready to make a decision after examining decision-related data and tradeoffs intuitively. Use of the deliberative phase should be considered anytime decisions present difficult tradeoffs and/or when making high stakes decisions, particularly those that cannot be reversed, such as having surgery. 
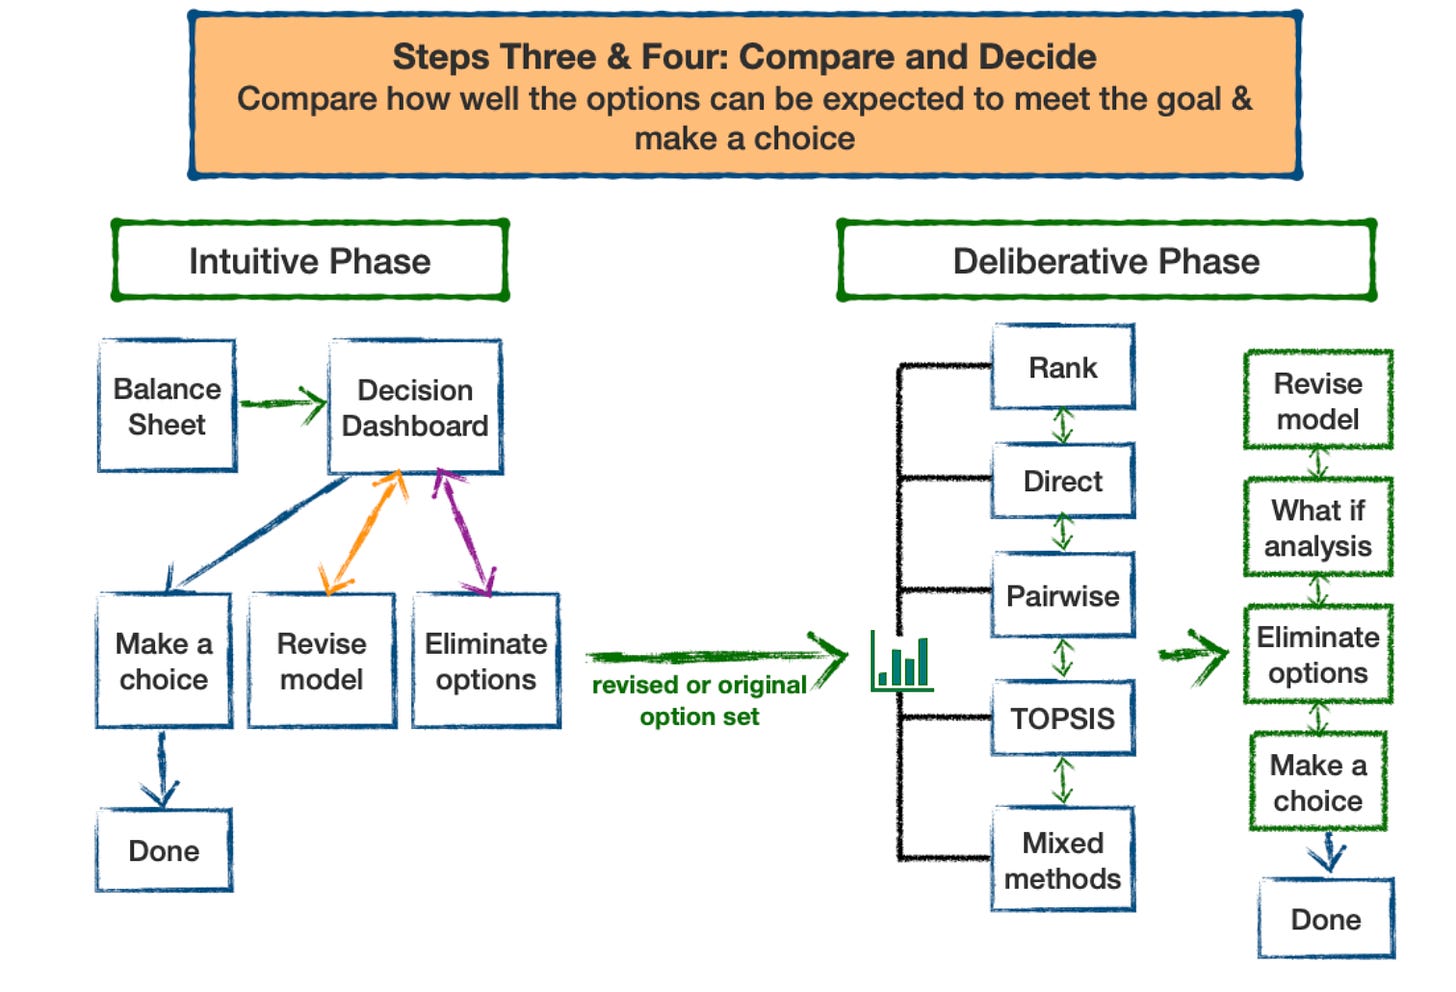
The BCDMF is based on multi-criteria decision analysis (MCDA). MCDA is designed to help people make better choices when decisions involve tradeoffs between competing decision objectives, a characteristic of many medical decisions. There are a number of well developed MCDA methods. They all use the same basic decision model but differ in the method used to identify preferred alternatives. A nice feature is that the methods can progressively build on each other, so it is possible to increase the complexity of an analysis without needing to start over. [1]

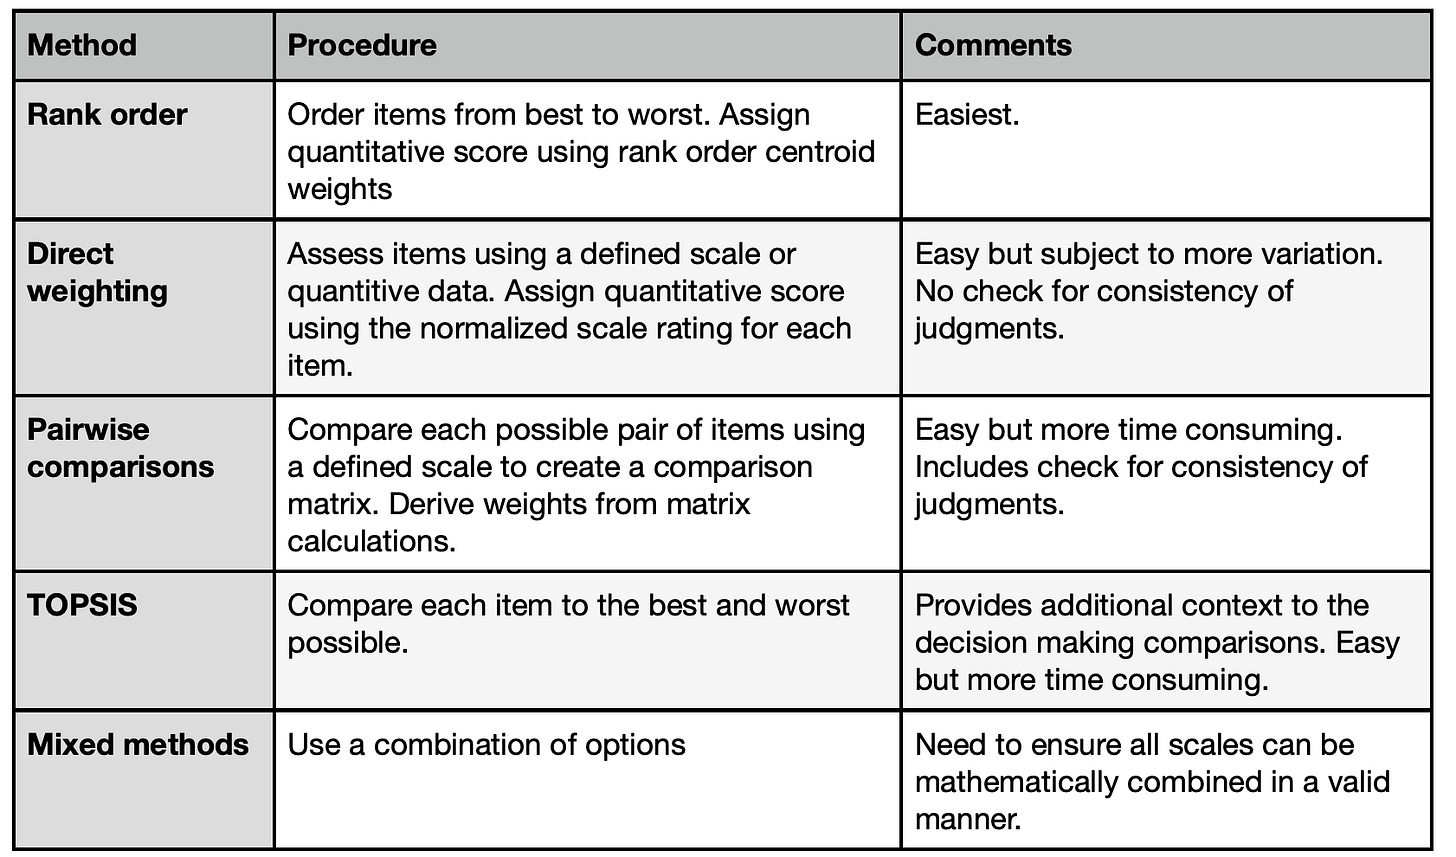
The methods included in the Busara Clinical Decision Making Framework are listed in the following table. They can be applied to both assessing the relative priorities of the decision criteria and how well the options meet the criteria. 
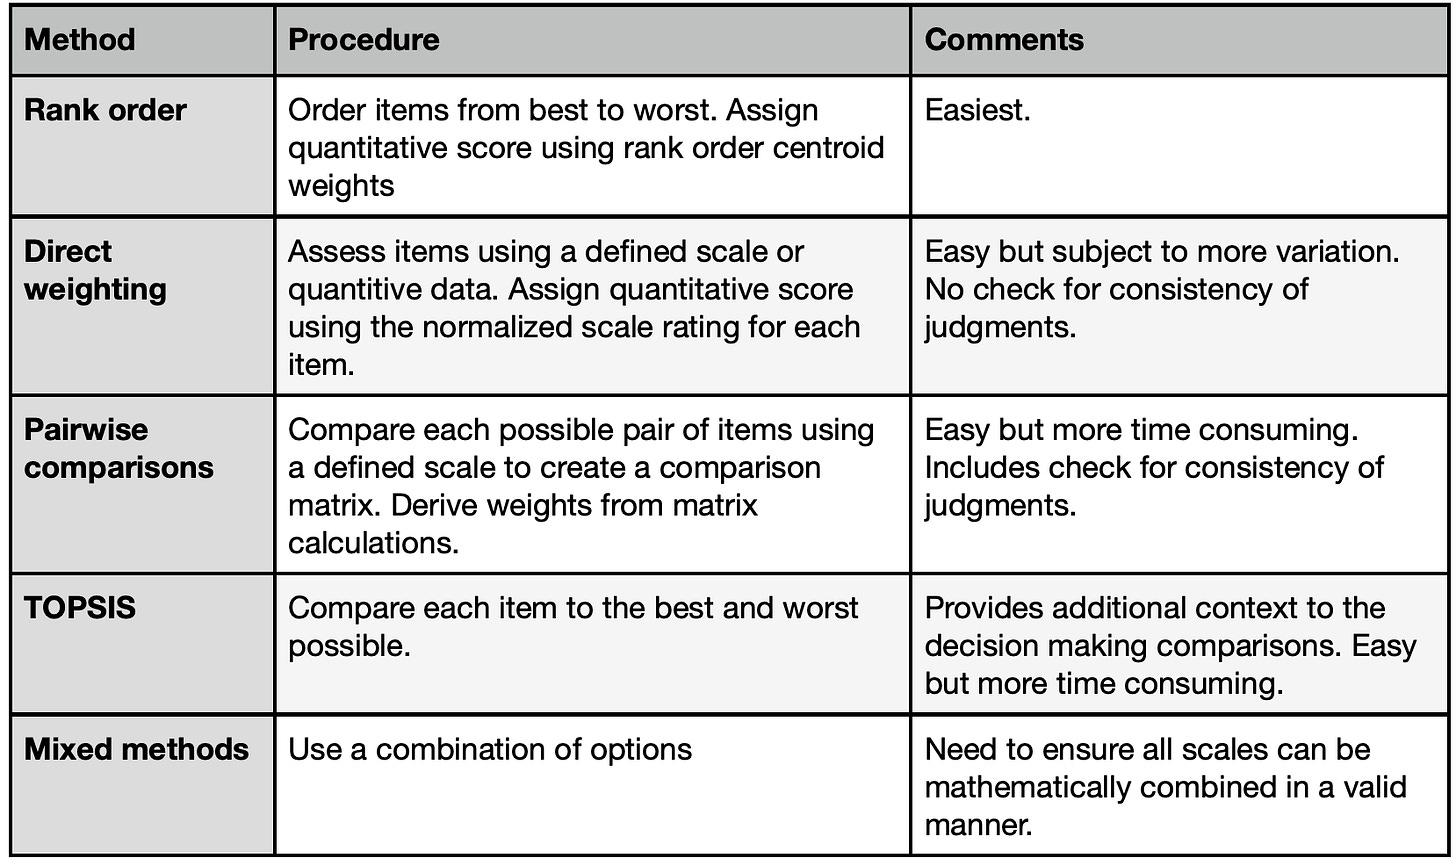
All of these methods work by creating quantitative scales that reflect decision makers judgments about how well the options meet the criteria and the priorities of the criteria relative to the goal. These scales help characterize the judgments being made in the decision making process more exactly than possible using qualitative terms or intuitive feelings. They therefore provide a new and enhanced way for decision makers to  communicate with each other about their preferences and priorities. They also enable decision makers to explore how changing their initial preference and priority judgments affects the overall assessments of the options under consideration. 

Pairwise Comparisons

The BCDMF pairwise option approach reduces the decision judgments to their simplest form: a single judgment between just two of the decision elements (options or criteria). This approach is used in the Analytic Hierarchy Process (AHP) a well-known decision making method. 

The advantage of the pairwise method is that it focuses attention on each individual component of the decision. In doing so, it provides a fundamentally different way of thinking about the tradeoffs and judgments involved in making a decision than the other methods included in the BCDMF (and many other formal decision making techniques). This difference can help decision makers gain additional insight into the decision at hand and help them refine their personal preferences and priorities. The disadvantage of the method is the inevitable increase in the number of discreet judgments that must be made if the decision is broken down so completely. 

The benefit of the approach depends on whether the additional insight is worth the additional work involved. Examples include situations where a clear best choice has not emerged after using the other methods provided in the framework and when making a particularly high stakes decision, where the role of a good decision making process is paramount. A good way to use the pairwise comparison format is to minimize the work involved by using the earlier steps in the process to highlight the key features of the decision and identify a short list of options that are worth further in-depth analysis.

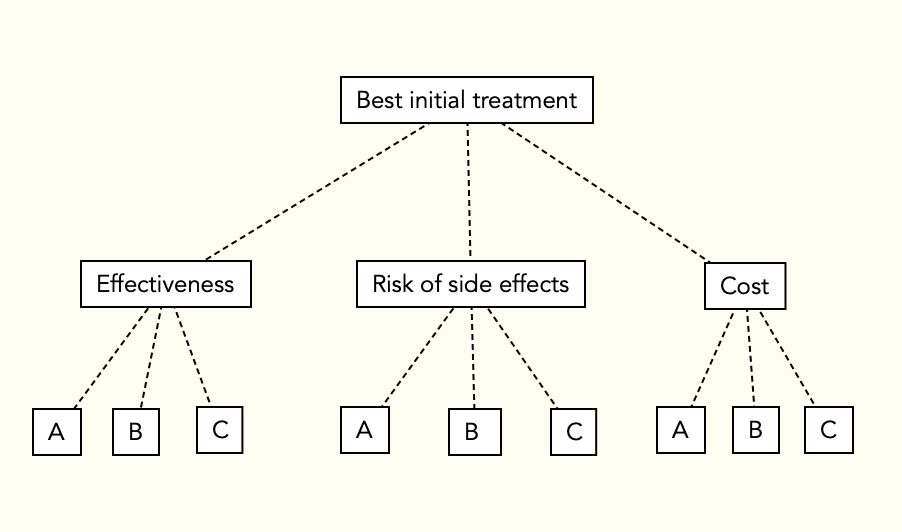
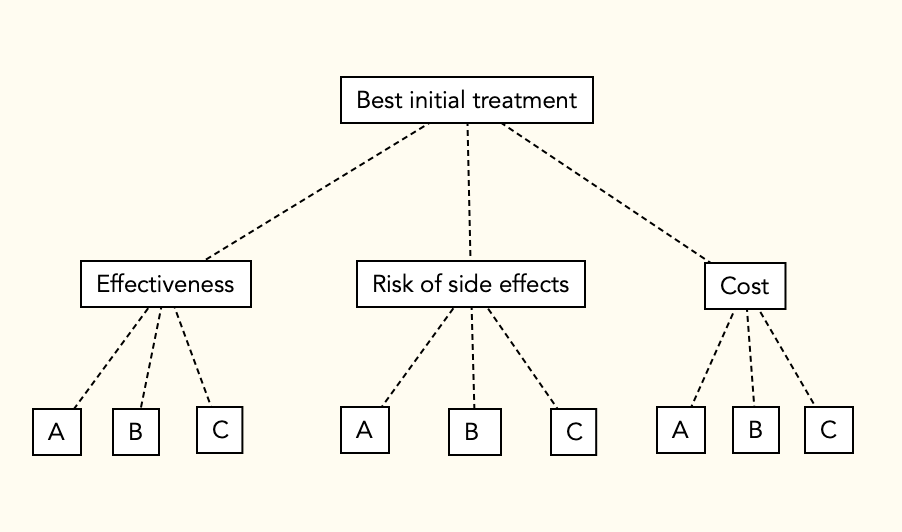
To illustrate, let’s continue to use the example scenario where a doctor and a patient named Anna are choosing among 3 possible treatment options using the following decision model. 
They collect data summarizing how well each option will fulfill each of the three decision criteria:

They then evaluate the options and prioritize the criteria using both ordinal rank weights and direct weights, as explained in the last two Musings. The results are summarized below:

Now let’s assume that on the basis of the analysis so far, Anna eliminates Option B from consideration but is still unsure whether she prefers Option A, which is better in terms of effectiveness, or Option C, which is the safer option. She also decides to eliminate the cost criterion, since she can afford both of them equally well. The resulting decision matrix is shown below: 
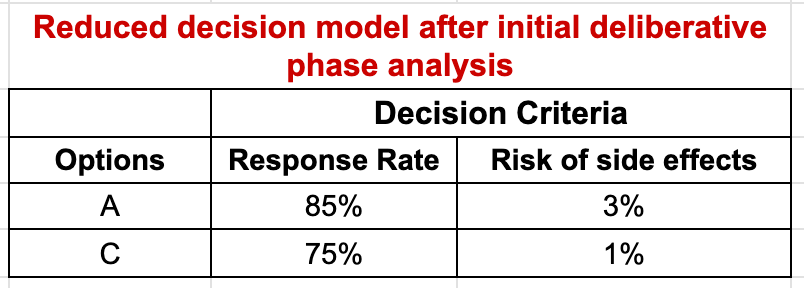
Anna and her physician then decide to use the Pairwise Comparison technique to take a closer look at the differences between these two options. For the judgments regarding how well the options fulfill the criteria, the first step is to decide if the two options are equivalent. If not, the preferred option is identified and the strength of preference judged on a four-point scale: slight (2), moderate (3), strong (4), or very strong (5). These judgments are then entered into a judgment table or matrix. With only two comparisons, this is a 2×2 table. Each row show the relationship between the Row option and the Column option:

Option scores are calculated by normalizing the geometric means of the row totals. The comparisons between the criteria are made the same way with the judgments made in terms of how important each is relative to the goal of the decision.

The judgments required for Anna’s analysis are summarized below:

  • Response Rate: Option A (85%) vs Option C (75%)
  • Risk of Side Effects: Option A (3%) vs Option C (1%)
  • Response Rate vs Risk of Side Effects relative to the decision goal

Let’s assume that  Anna moderately prefers A to C relative to Response Rate, slightly prefers C to A relative to Side Effects, and judges Response Rate moderately more important than risk of Side Effects relative to the decision goal. The resulting comparison tables, geometric means, and scores are shown below:

The final results are calculated using the weighed average method, just like the ordinal rank weighting and direct weighting methods: overall scores are calculated for each option by multiplying the option criteria weights times the criteria priorities and summing the results. To make it easier to review and discuss the scores, they are multiplied by 100 to remove the decimal places.

Musings

Although this and the other deliberative methods I have described seem complicated, that is only because I have been explaining how things work “under the hood”. Once the calculations are programmed into a suitable app or spreadsheet, the process only requires attention to the judgments being made. 

As I mentioned previously, another advantage of the quantitative deliberative methods is the ability to determine how changes in judgments would affect the final results. The ability to ask “what if” can add a great deal of insight into the key aspects driving a decision. 

References

1. Dolan JG. Multi-Criteria Clinical Decision Support: A Primer on the Use of Multiple-Criteria Decision-Making Methods to Promote Evidence-Based, Patient-Centered Healthcare. The Patient: Patient-Centered Outcomes Research. 2010 Dec;3(4):229–48.

The Busara Clinical Decision Making Framework Deliberative phase – Part 2

Direct Weights

The Busara Clinical Decision Making Framework (BCDMF) deliberative phase is designed to be used when decision makers are not ready to make a decision after examining decision-related data and tradeoffs intuitively. Use of the deliberative phase should be considered anytime decisions present difficult tradeoffs and/or when making high stakes decisions, particularly those that cannot be reversed, such as having surgery. 

The BCDMF is based on multi-criteria decision analysis (MCDA). MCDA is designed to help people make better choices when decisions involve tradeoffs between competing decision objectives, a characteristic of many medical decisions. There are a number of well developed MCDA methods. They all use the same basic decision model but differ in the method used to identify preferred alternatives. A nice feature is that the methods can progressively build on each other, so it is possible to increase the complexity of an analysis without needing to start over. [1]

The methods included in the Busara Clinical Decision Making Framework are listed in the following table. They can be applied to both assessing the relative priorities of the decision criteria and how well the options meet the criteria. 

All of these methods work by creating quantitative scales that reflect decision makers judgments about how well the options meet the criteria and the priorities of the criteria relative to the goal. These scales help characterize the judgments being made in the decision making process more exactly than possible using qualitative terms or intuitive feelings. They therefore provide a new and enhanced way for decision makers to  communicate with each other about their preferences and priorities. They also enable decision makers to explore how changing their initial preference and priority judgments affects the overall assessments of the options under consideration. 

In last week’s Musing (April 28, 2023), I described the rank order weighting method. The beauty of the rank order weights is their simplicity. Once the rankings are established the work is done. However, how well they work depends on how accurately the rank order weights match the judgments of the decision maker(s). For this reason, the BCDMF tool contains a direct weighting module that allows decision makers to adjust the weights that have been automatically assigned by the ranking process. (This module can also be used directly – there is no need to do the ranking first.)

To review, suppose a doctor and a patient are choosing among 3 possible treatment options using the following decision model. 

They collect data on how well each option meets the three criteria and rank order them for best to worst in each category. The results of the example ranking and ordinal rank weights are shown below. 

They also rank order and weight the three decision criteria in terms of how important they are in meeting the goal of picking the best initial treatment option:

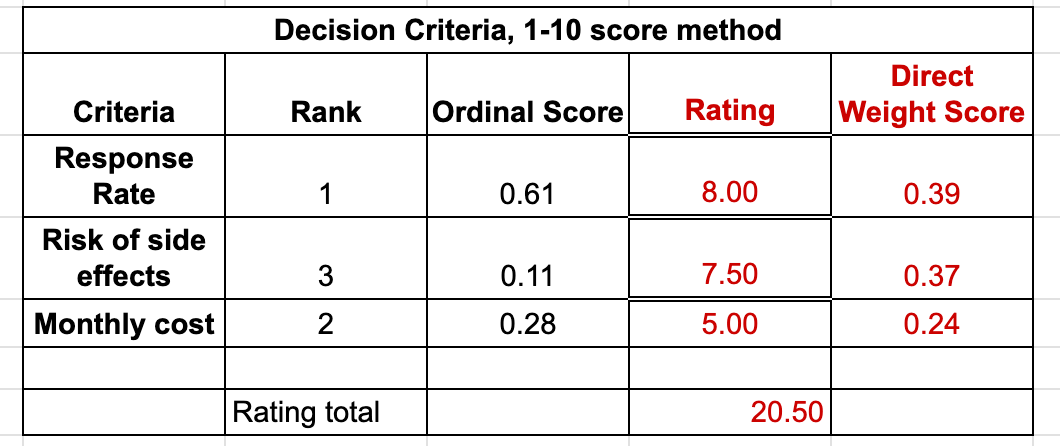
Now let’s assume that our example patient does not agree with these rank-assigned weights. She and her physician therefore decide to use direct weights to adjust them to more closely match her preferences. There are several ways to do this. A common method is to rate the items on a 1-10 scale and then normalize the results by dividing each rating by the sum of all ratings. An example rating process for the options relative to the Response Rate criterion is shown in the following table:

The same procedure is then used to assign priority scores to the decision criteria in terms of how important they are in achieving the goal of the decision:

The analysis is completed using the same method as with ordinal ranking scores. After the options have all been compared relative to the criteria and the criteria compared relative to the goal, overall scores are calculated for each option by multiplying the option criteria weights times the criteria priorities and summing the results, a procedure similar to calculating a weighted average. To make it easier to review and discuss the scores, the scores are multiplied by 100 to remove the decimal places. (See details in the April 28, 2023 Musing.)

If you would like to explore the direct weighting procedure further, I’ve made a Google Sheets file that will do the direct weighting for the example problem. It can be assessed using this link, I hope. If you have problems accessing it, please send me a comment and I will try to fix it.

Musings

Like the ordinal rank weighting methods, the direct weighting method is easy to use and can be programmed into any spreadsheet, so can be implemented quickly and easily. The direct weighting method shares the advantages of the ordinal ranking method but, in addition, can more accurately reflect a decision maker’s decision preferences and priorities than is possible using ordinal rank weights.

In some cases the additional information provided by this analysis will provide enough information to help decision makers reach a decision. If not, the BCDMF provides two additional modules that take a different approach to analyzing a decision that can provide additional insight into a complicated decision making scenario. I will describe these in upcoming Musings. 

References

1. Dolan JG. Multi-Criteria Clinical Decision Support: A Primer on the Use of Multiple-Criteria Decision-Making Methods to Promote Evidence-Based, Patient-Centered Healthcare. The Patient: Patient-Centered Outcomes Research. 2010 Dec;3(4):229–48.

The Busara Clinical Decision Making Framework Deliberative phase – Part 1

Ordinal ranking

The Busara Clinical Decision Making Framework (BCDMF) deliberative phase is designed to be used when decision makers are not ready to make a decision after examining the data and tradeoffs intuitively. Use of the deliberative phase should be considered anytime decisions present difficult tradeoffs and/or when making high stakes decisions, particularly those that cannot be reversed, such as having surgery. 

The BCDMF is based on multi-criteria decision analysis (MCDA). MCDA is designed to help people make better choices when decisions involve tradeoffs between competing decision objectives, a characteristic of many medical decisions.

There are a number of well developed MCDA methods. They all use the same basic decision model but differ in the method used to identify preferred alternatives. A nice feature is that the methods can progressively build on each other, so it is possible to increase the complexity of an analysis without needing to start over. [1]

The MCDA methods included in the deliberative phase of the BCDMF work by creating quantitative scales that reflect decision makers judgments about how well the options meet the criteria and the priorities of the criteria relative to the goal. These scales help characterize the judgments being made in the decision making process more exactly than possible using qualitative terms or intuitive feelings. They therefore provide a new and enhanced way for decision makers to communicate with each other about their preferences and priorities. They also enable decision makers to explore how changing their initial preference and priority judgments affects the overall assessments of the options under consideration. 

The methods included in the Busara Clinical Decision Making Framework are listed in the following table. They can be applied to both assessing the relative priorities of the decision criteria and how well the options meet the criteria. 

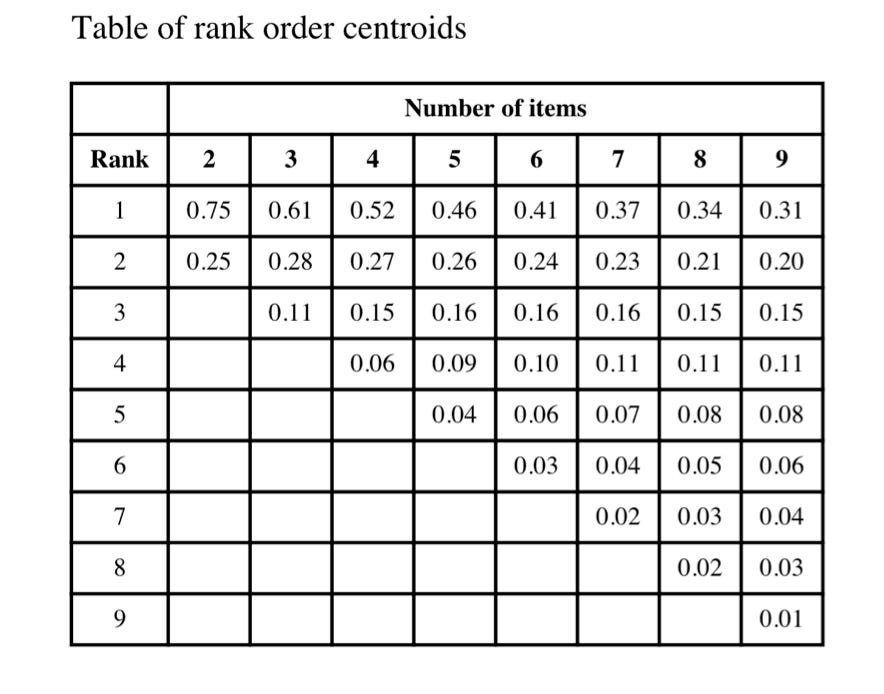
The simplest method, rank order, assigns values to decision elements based on their ordinal rank order using a method called rank order centroids, a  measure of the distance between adjacent ranks on a 0 to 1 normalized scale. [1,2,3] Rank order centroids can be calculated directly, but pre-calculated tables , like the one shown below, are readily available.

To use the method, the decision maker(s) orders the items being compared from best to worst and then assigns the appropriate rank value. If there are ties, the average of the values for the tied values are used.

To illustrate, suppose a doctor and a patient are choosing among 3 possible treatment options. They create the following decision model and then obtain information about how well the alternatives meet the criteria and summarize it in a decision table:

Unsure which treatment is best, they rank order both the importance of the three criteria and how well the three options meet each criterion. Once completed, they  assign the appropriate rank order weights. As shown in the rank order centroid table, with three items, the value assigned to the highest ranked item is 0.61. The values for the 2nd and 3rd ranked items are 0.28 and 0.11.

In this example, as in most real world decisions, the priorities of the decision criteria are subjective judgments. Because the data showing how well the options meet the criteria are all quantitative in the example, they are easy to rank order. It is also possible to include criteria that are not assessed quantitatively. For these criteria the rank ordering is done subjectively, like the criteria priorities. 

The results of the example ranking process are shown in the following two tables:

The analysis is completed by creating overall scores for each option by multiplying the option criteria weights times the criteria priorities and summing the results, a procedure similar to calculating a weighted average. To make it easier to review and discuss the scores, the scores are multiplied by 100 to remove the decimal places:

The results show that Option B is the best with an overall score of 42, followed by A and then C. If, on the other hand, Risk of Side Effects was ranked most important and Response Rate second, the best choice is C with a score of 43, followed by A (score = 32) and B (score = 25).

Musings

This method is easy to use and can be programmed into any spreadsheet, so can be implemented quickly and easily. In addition to ease of use, its main advantages are that the rankings and ranking scores give decision makers a new language to discuss and compare their decision priorities and explore how different priorities would change the option scores. Its main disadvantage is the fixed nature of the rank values may not accurately reflect decision maker’s judgments about the magnitude of the differences between the options and criteria.

In some cases the additional information provided by this analysis will provide enough information to help decision makers reach a decision. If not, it serves as the foundation for additional deliberative procedures that will provide increasing amounts of information about decision judgments and priorities that I will review in future Musings.

References

1. Dolan JG. Multi-Criteria Clinical Decision Support: A Primer on the Use of Multiple-Criteria Decision-Making Methods to Promote Evidence-Based, Patient-Centered Healthcare. The Patient: Patient-Centered Outcomes Research. 2010 Dec;3(4):229–48.

2. McCaffrey JD. Using the Multi-Attribute Global Inference of Quality (MAGIQ). Technique for Software Testing 2009;2009:738–742.

3. Edwards W, Barron FH. SMARTS and SMARTER: Improved Simple Methods for Multiattribute Utility Measurement. Organizational Behavior and Human Decision Processes 1994;60(3):306325.

Knowing is not enough, we must apply

“I have been impressed with the urgency of doing. Knowing is not enough; we must apply. Being willing is not enough; we must do.” ~ Leonardo da Vinci


Atrial fibrillation (AF) is the most common arrhythmia in the general population. Anticoagulation to prevent embolic events is a key part of the management of patients with atrial fibrillation. For many years warfarin, a vitamin K antagonist, was the only anticoagulant option. The introduction of a group of direct acting anticoagulants has made the choice of treatment more complicated. Compared with warfarin the newer agents do not require frequent monitoring and are somewhat more effective and safer, but more expensive.

In the February 2023 issue of Medical Decision Making, Kathryn Martinez and colleagues published a brief report describing their analysis of how well physicians engaged patients with atrial fibrillation in shared decision making regarding the choice of anticoagulant. [1] Recorded conversations were evaluated for 7 key elements of shared decision making using a list first developed by Braddock and colleagues in 1999. [2] The authors found that physicians frequently omitted elements of the shared decision making process and, in particular, rarely assessed patient preferences. They concluded:

Multiple professional societies support informed decision making for anticoagulation in patients with AF. Data from these real-world encounters of physicians and patients making these decisions suggest informed decision making is largely not taking place. Use of decision aids to support anticoagulation decisions may facilitate more complete informed decision making.

Musings

This paper is well done and calls appropriate attention to an important, complex decision faced by patients with atrial fibrillation. However I wish it had done more. Many prior studies, including the seminal paper by Braddock that was the source of the study methodology, have found similar results. After more than two decades, I think it is firmly established that physicians do not engage patients in shared decision making as often as they should. The outstanding questions are what can be done about it and who should take the lead in fixing the problem.

Medical education institutions and organizations producing clinical guidelines are the two most obvious places where progress could be made. Medical curricula could be modified to include explicit training in decision making tailored to provide students a firm background in the practice of good decision making, but results will take time. The quicker approach is to adapt practice guidelines to include decision models populated with decision-focused summaries of the research data that was reviewed that support the guideline recommendations.

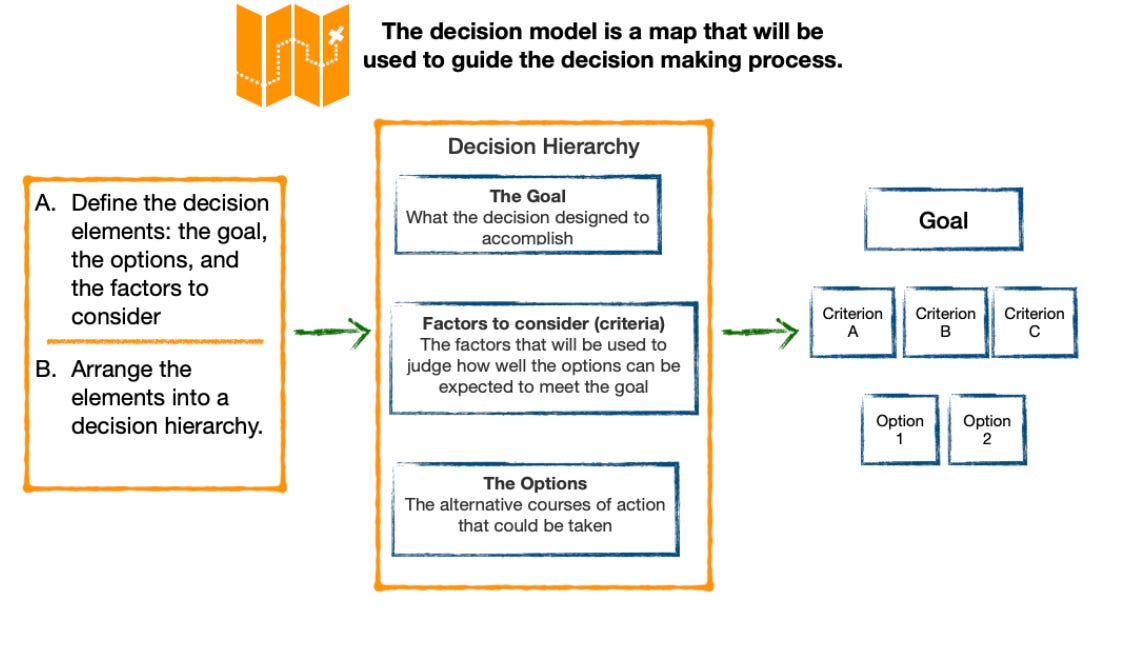
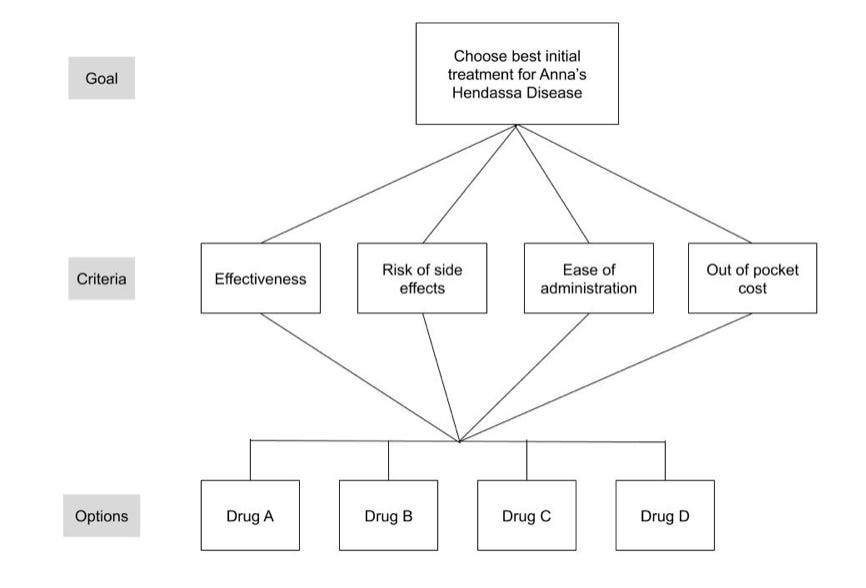
To illustrate, let’s consider what it would take to create a decision model alongside a clinical guideline. Imagine a guideline panel is meeting to issue guidelines for treatment of a fictitious condition called Hendassa Disease. After reviewing the literature, the panel has decided to endorse four drugs for clinical use: Drugs A,B,C, and D. In addition to a written summary of the data and their recommendation, they create a decision model for an illustrative patient called Anna. The design of a decision model is outlined in the first figure below, the illustrative patient model created by the guideline panel in the second.

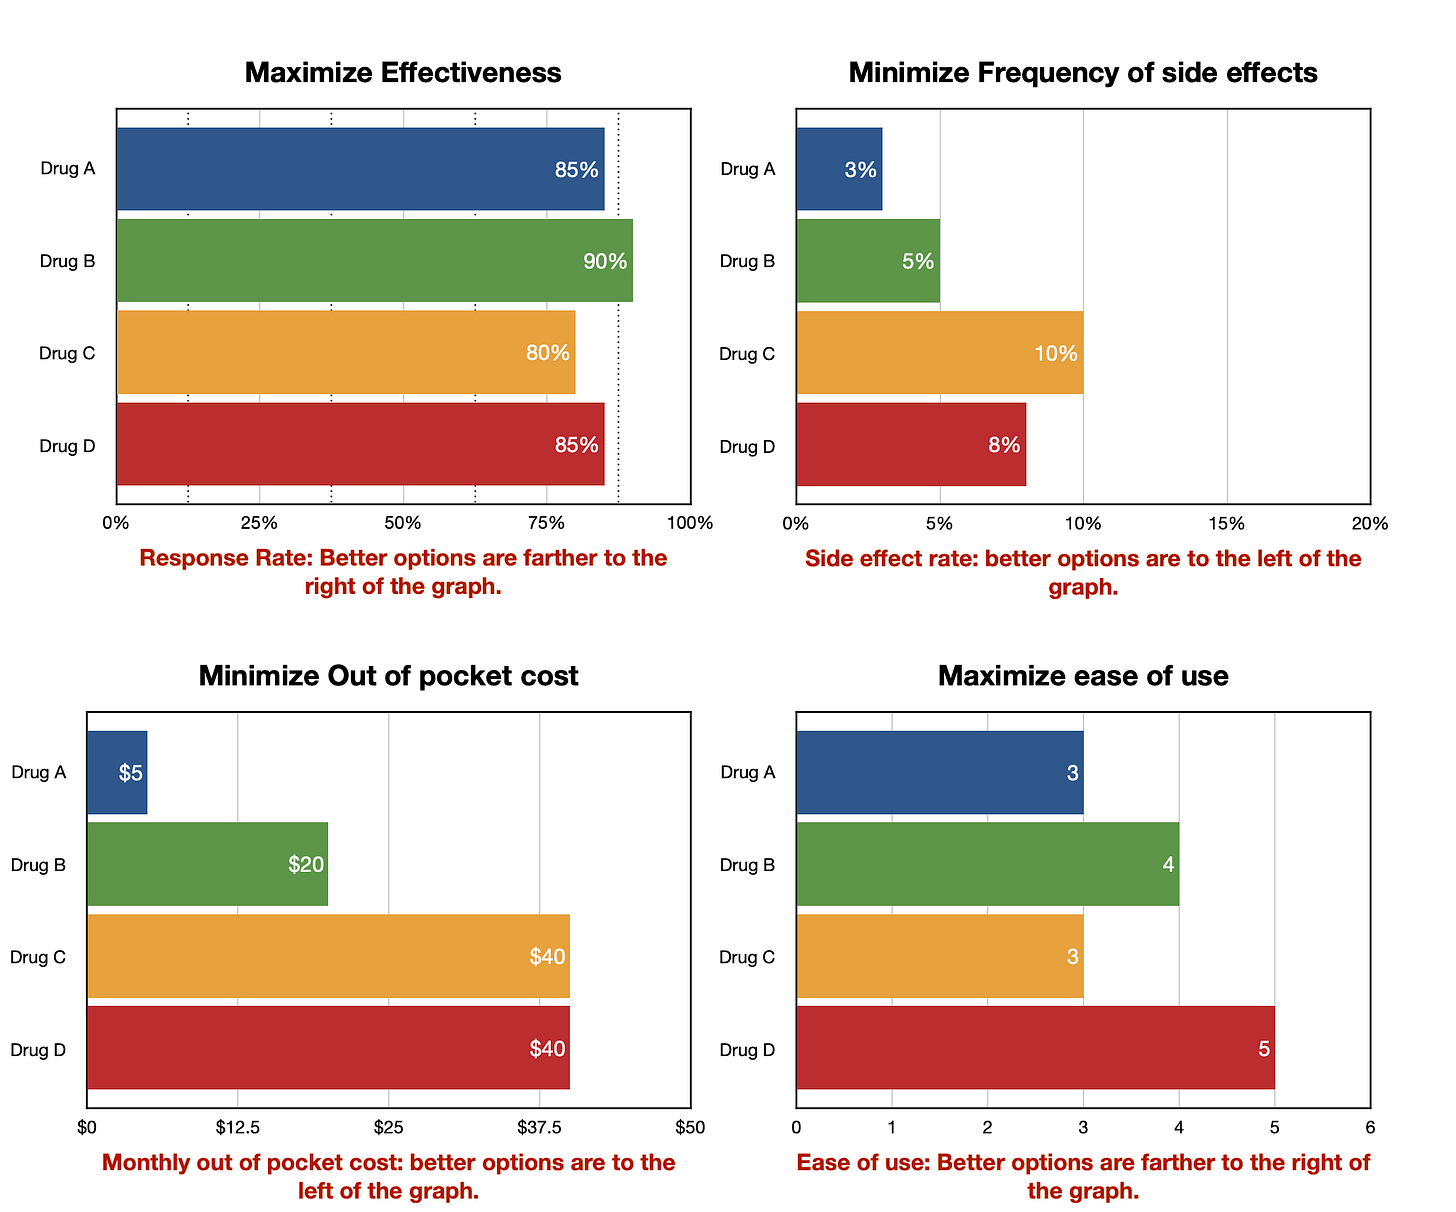
The next step for guideline developers would be to summarize information about the four treatment options in a manner that facilitates comparisons between their respective pros and cons. Ideally this would consist of a summary table and a corresponding decision dashboard. Examples of both formats are shown below. Note the dashboard has some example patient data input for this illustration. In practice, the guideline panel would leave this field empty, to be assessed by individual patients, as shown in the table.

This decision model and data summary would then be distributed along with the practice guidelines to provide clinicians with a ready-made platform for informing patients about the decision at hand and inquiring about their decision related preferences and values.

Creating a decision model and decision-oriented data summary like this could potentially increase the utility of guideline research and recommendations while requiring little additional effort by guideline panels. It seems to me someone should give it a try.

References:

1. Martinez, Kathryn A., Debra T. Linfield, Victoria Shaker, and Michael B. Rothberg. 2023. “Informed Decision Making for Anticoagulation Therapy for Atrial Fibrillation.” Medical Decision Making 43(2): 263–69.

2. Braddock III, C. H., Edwards, K. A., Hasenberg, N. M., Laidley, T. L., & Levinson, W. (1999). Informed decision making in outpatient practice: time to get back to basics. Jama, 282(24), 2313-2320.

The promise of “prepared” clinical decision models: Better clinical decisions, more effective guidelines, and vertical integration of shared decision making throughout the health care system.

In the December 16, 2022 Musing, I described how creating tangible, explicit clinical decision models could improve the quality of medical care and promote informed, shared decision making. In this week’s post, I followup on two other ideas I mentioned briefly: creating “prepared” maps at the clinical level and using clinical decision models to promote vertical integration of shared decision making throughout the different layers of the health care system.

“Prepared” clinical decision models

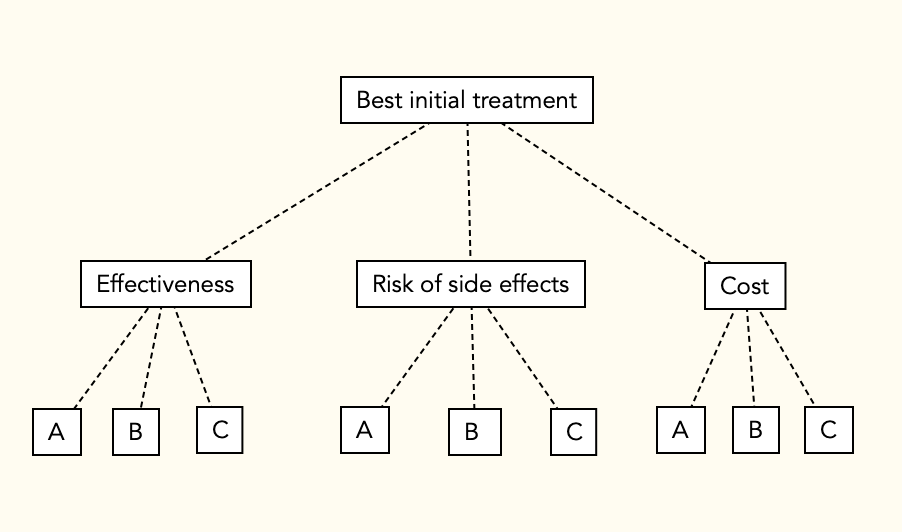
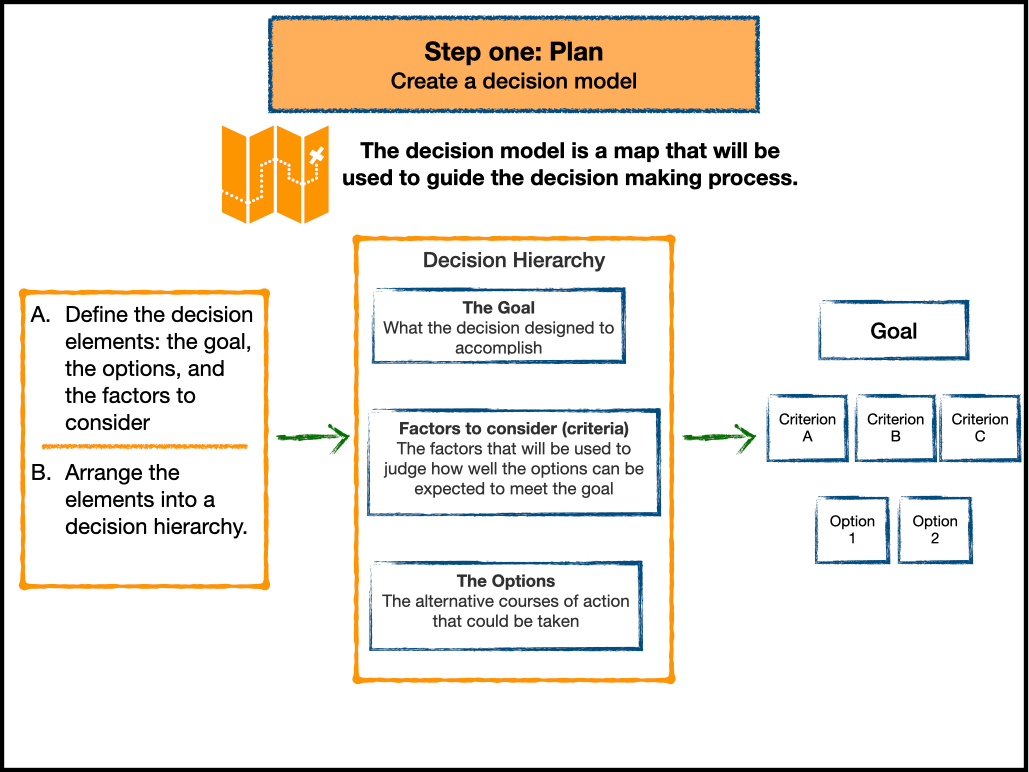
As shown in the figure below, the proposed hierarchical decision model has an explicit statement of the goal of the decision at the top, a list of options at the bottom, and a layer containing the considerations being used as criteria to define good choices, i.e., those likely to meet the decision goal, in the middle.

Although the goal and options will vary depending on the situation, most clinical decisions share a group of common decision considerations: effectiveness, risk of adverse effects, cost, and the logistics involved (time required, means of administration, etc.).

One way to meet the quality goal of improving the decision making skills of patients is to introduce patients to the concept of decision mapping in a brief preliminary session. In the session they would work through a small number of hypothetical examples designed to teach them about the decision mapping process and give them a deeper understanding of the generic decision considerations. A patient-specific starter model derived from this session could then be used as the starting point to address an important future decision.

During the training phase, it would also be possible to show the patients what their physician’s generic set of decision considerations are for the same sample scenarios. This step would set the stage for enabling both parties to use decision models as a new communication medium for discussing clinical decisions and sharing in the decision making process.

Vertical integration

Taking the idea of prepared decision maps a step further, I see no reason why a clinical guideline panel could not create a generic decision model that would be published along with their recommendations. The guideline panel model would include factors included in the panel deliberations and a summary of the information gathered about each recommended option. Importantly, when included in a decision model, this information would be transmitted to clinicians and patients in a format directly applicable to using it to make a decision, rather than a text-heavy summary of findings.

In addition to providing structure and format to the decision making scenario, the guideline decision model could, and should, include information about the relative priorities the panel assigned to their decision criteria. A full guideline model in this format would explicitly summarize the reasoning and information that are the basis for the panel recommendations and thereby clarify the information and advice provided. The resulting models could then be examined and adjusted as needed to meet the needs of individual patients in the clinical setting.

It is important to note that the avenue of communication provided by using a communal decision model runs both ways. In addition to the information going from the guideline panel level to the clinical level, the alterations made by the clinical decision makers, reflecting the needs and priorities of individual patients and clinicians, could be fed back to the guideline panel and used to further refine the guideline recommendations. In other words, using guideline decision models in this way would create a feedback learning loop, that could operate in a regular fashion without the need for special studies.

Musings

Many, if not most, difficult clinical decisions involve trade-offs between competing objectives. For this reason, the proposed default clinical decision model is designed to identify the objectives the decision makers want to accomplish and facilitate the process of making any necessary trade-offs.

The idea of creating a decision model is not radical. It is one of the major contributions of decision analysis to the world. In practical terms it is no different from using a map to travel from one place to another or assembling a piece of Ikea furniture. It is true that it has not been done before, but that is no reason to conclude it cannot be done and is not worth a try.

Transparent decision making part 2

“Hello.”

“Hi, this is the NCAA calling. We read your recent blog post about how we should improve the selection process for our D1 baseball tournament. The idea sounds good, but your post doesn’t say anything about how we could make things better. Could you tell us how we could make the tournament selection process for teams receiving at-large tournament bids transparent, logically consistent, and, perhaps, more fair?”

“Sure. There are two things to consider. First, what an ideal selection process would look like and second, how to help the selection committee come as close as possible to implementing the ideal selection process given the time and resource constraints they are working with.

To me, an ideal selection process would consist of a set of well-defined, objective criteria that can be measured accurately for every D1 team. Using this method, the general framework for the selection process would be defined and look something like this:

ncaa model

The teams would then be ranked separately for each criterion based on how well they did on that one measure. Then the relative priorities of the selection criteria would be determined. If they are all considered equally important, each criterion would be weighted equally. If not, the committee would determine the relative priorities and decide how much weight should be given to each in making a tournament selection. Finally, the criteria weights and team rankings would be combined to create a summary score for each team. The teams with the highest 33 summary scores would then be invited into the tournament. Below is an example how this would work, with Team B receiving a higher tournament ranking than Team A.

ncaa selection process scores

Using this method, the selection announcement would include both the names of the teams given at large bids and a explicit description of how the selections were determined. I think this system would go a long way toward addressing the concerns Coach Hartleb raised as well as those voiced by others.

“That sounds pretty complicated. Is it really possible to do something like that in the real world?”

“Yes it is. The tournament selection process is just one example of a multi-criteria decision making situation. People in a myriad of situations face similar decisions every day and need to cope with challenges similar to those faced by the tournament selection committee. Recognizing how common this type of decision is, and the important consequences that many such decisions have, decision science researchers have developed a number of methods for helping people make better decisions in these situations.  A wide spectrum of approaches are available ranging from relatively simple to quite sophisticated. Many are easy to use and do not require special training or expertise. They are particularly helpful in group decision making situations, like the tournament selection process. Some even accommodate both objective data and subjective ratings so you can still adopt this approach even if good objective measures are not available for every criterion deemed important for making a tournament selection.

I hope you find this information helpful. Thanks for calling and good luck with this year’s tournament.”


Decision Transparency


Transparency, the ability to easily explain the rationale for choosing one alternative over another, is an important component of good decision making in situations where a choice will affect multiple parties not involved in the decision making process. The importance of decision transparency is well illustrated by the questions raised regarding the selection of the teams who will participate in the 2018 NCAA division 1 (D1) college baseball tournament on an “at large” basis.

Sixty four teams are chosen for the tournament. Thirty one conference champions receive automatic bids. The remaining 33 teams are chosen based on “at large” bids. These bids are based on the selection committee’s assessment of how well the team did during the regular season.

A number of performance indicators to guide this process have been identified, however it is unclear how they are implemented to choose the teams that receive the at large bids. This situation is well described by University of Illinois head coach Dan Hartleb:

The thing I think that’s frustrating probably for every coach out there — it’s not just Illinois baseball — is the committee does have a list of criteria, but it’s not like the criteria is listed [numbered in order] 1, 2, 3, 4, 5, 6 and, ‘This is how we go about it.’ It’s a year-by-year, case-to-case different numbers. And I’m not saying that’s avoidable, but it just makes it very difficult to know what you have to do. There’s a couple teams that get in that you beat head-to-head. You have better RPI in one situation. Strength of schedule isn’t even close in another situation. They’ve told us in the past that they look at the last 10 to 15 games, and one of the teams that got in was 2-11 [to end the season] with 10 losses in a row. Those are all at-large bids. Those things are the things that — again, I’m not saying they’re avoidable — but they’re things that you question. (https://247sports.com/college/illinois/Article/Exit-interview-Illinois-Fighting-Illini-baseball-coach-Dan-Hartleb-discusses-end-of-2018-season-NCAA-Tournament-selection-process-and-needed-facilities-upgrades-118638019)

Making the NCAA tournament is the goal of every college baseball program. A process that fails to explain why some apparently deserving programs were excluded is fundamentally flawed. I disagree with Coach Hartleb that the inconsistencies in the selection process are unavoidable. They are. Well developed multi-criteria decision making methods are available that would make the selection process more transparent, logically consistent, and, perhaps, more fair. It is time for the NCAA to use one or more of them in the tournament selection process.


Marching to the beat of a different drummer

For a long time I have admired Malcolm Gladwell. He is a terrific writer with a gift for making complex ideas understandable to the general public, even though I don’t always agree with his conclusions. If you like how he writes, I suggest you hear him speak – he is just as good if not better. I first heard him speak at a Society for Medical Decision Making meeting several years ago. He gave a wonderful presentation without slides – very refreshing at a scientific conference overflowing with powerpoint – and excelled during the open question and answer period. I was therefore very excited to learn that he has a new podcast called “revisionist history“.

I started with episode 3 “the big man can’t shoot” which is about why Wilt Chamberlain, refused to shoot free throws underhanded, even though he doubled his free throw percentage during a short time he used this technique and there was clear evidence that it is the most accurate way to shoot free throws, at least per Rick Barry (also interviewed in the podcast). Wilt is not alone in this regard.  Shaquille O’Neil , LeBron  James, and  almost every other NBA player have not adopted this approach even though it could help their teams win games.

The hypothesized reason, attributed to the threshold model of group behavior posited by Mark Granovetter, is that all of these players have a high threshold for conforming to group norms. Because the group looks on underhand free throws as silly or “shooting like a sissy”, most players resist trying it because the influence of the group norm is stronger than their motivation to accomplish other objectives (like scoring points and winning games). Rick Barry on the other hand, a NBA hall of famer who played about the same time as Wilt Chamberlain, always shot free throws underhand and had a free throw percentage in the upper 90’s. It is clear from the episode that he had much less regard for group norms and was willing to go against the status quo to achieve other goals.

Coincidentally, the day after I listened to this I came across another example of a major sports person willing to do things differently because it works: Joe Maddon, manager of the Chicago Cubs. In an extra-innings  game earlier this week, he had a pitcher play the outfield. By having 2 pitchers in the lineup he could optimize the matchups with opposing batters without constantly changing pitchers and losing players eligible to keep playing.

This threshold model seems similar to status quo bias and possible other proposed explanations for why people tend to “do things they way they always do it” instead of trying a new approach, even if there is good evidence that the new approach will work better. It also seems related to concepts of inventiveness and creativity. In any case, I wonder how many opportunities are lost as a result of overly high thresholds for changing models of patient care and medical decision making. I also wonder if a multi-criteria framework that clearly identifies the goal of a decision and the objectives to be achieved would help adjust poorly calibrated thresholds to more appropriate levels.

New Prostate Cancer study website

Last week we created a new dedicated website for our prostate cancer research project: www.mcdm-med.com.

The site describes two of the studies that are now open: our internet trial of a decision dashboard vs a decision table for men with newly diagnosed low risk prostate cancer & our new prostate cancer survivor’s study.

The survivor’s study is a survey that asks men with a history of prostate cancer (regardless of stage or time of initial diagnosis) to review and comment on our current decision dashboard. It is also open to spouses and other close family members.

I invite you to check it out and spread the word to anyone who you think may be interested.

ISPOR 2016

I recently moderated a session entitled ” MCDA, a new paradigm in healthcare decision making? Current status,challenges and opportunities” at the recent ISPOR meeting in Washington, DC. I am grateful to Mireille Goetghebeur for organizing the session and inviting me to participate and greatly appreciate the chance to work with the other two panel members, Kevin Marsh and Mabel Moreno. 

My part was easy – I introduced MCDA and basically followed the outline provided by the first ISPOR task force on MCDA:

Multiple Criteria Decision Analysis for Health Care Decision Making—An Introduction: Report 1 of the ISPOR MCDA Emerging Good Practices Task Force
Thokaka P, Devlin, N, Marsh K, et al. Multiple Criteria Decision Analysis for Health Care Decision Making—An Introduction: Report 1 of the ISPOR MCDA Emerging Good Practices Task Force. Value Health 2016;19:1-13.

Kevin tried valiantly to criticize the use of MCDA and mostly  focused on problems that can happen when you apply it incorrectly except for the meta-question of how do you which MCDA method to use for a particular project. Mireille described the ethical and practical argument for adopting a MCDA approach to important healthcare decisions and Mabel described how it has been used in Colombia to set health policy.

The session was well-received and I think went well. Overall I was impressed by the amount of interest in MCDA that permeated the meeting and suspect it will be a topic that will continue to attract of lot of interest, applications, and new users over the coming years.